
The 1104 CPUs behind that dashboard
Uncovering what goes on behind the scenes to power the data surfaced in some of the dashboards at Shopify
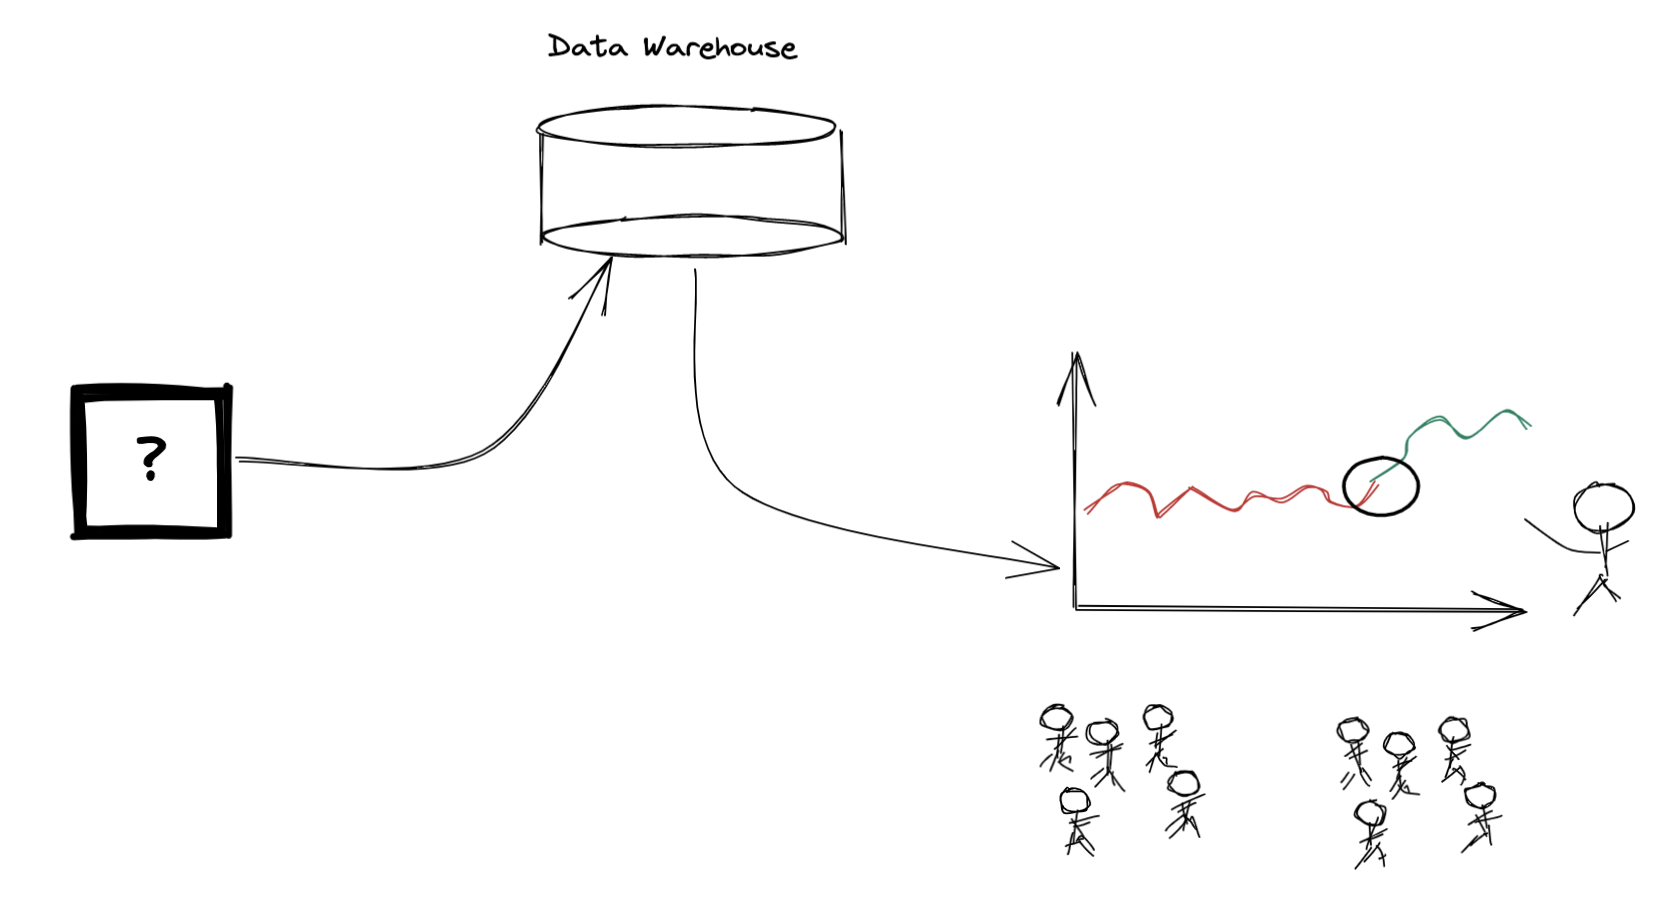
Everyone loves a good dashboard. Some people will appreciate that there is some database with a table that powers that dashboard. Very few people will have any idea how that data got there in the first place. This is a brief post to demystify what goes on behind the scenes. I hope that it brings more clarity and appreciation for the data plumbing work many data scientists do in their day to day.
Opening the black box
We recently shipped a dashboard to answer a bunch of questions related to how international buyers are getting localized on our merchant’s storefronts. For example, if a German 🇩🇪 buyer visits a US 🇺🇸 merchant’s website, and that merchant had enabled Euros through our multi-currency feature or translated their store into German, we want to understand how often that buyer is getting a shopping experience in Euros and German. In other words, how often are they getting correctly localized. We’re also interested in how and when this happens. Did they get the localized experience right from the start by landing directly on an International domain or getting automatically redirected? By manually switching themselves using a country/currency/language selector? Or through accepting a country recommendation popup?
By measuring our ability to localize buyers, we can continuously improve the products responsible for this and consequently drive more international sales for our merchants. Additionally, if we observe that merchants have abnormally low localization rates, we can alert them of these issues and suggest a change to their storefront configuration.
To begin to start answering questions like this, we first needed to see if we had the data we required. That answer was no.
Tracking the buyer experience
![]()
In order to answer the questions I listed above, we needed to start logging new events to track:
- When buyers see a popup containing a recommendation to switch their country/language
- If a buyer accepts this recommendation 👆
- If a buyer was automatically redirected to another International domain
- If a buyer’s currency is automatically updated in checkout due to international pricing restrictions (something we want to minimize over time)
Some of these were implemented on the frontend, while others, like the system generated redirects, were done on the backend. In all cases, they required close collaboration and communication with engineers from a variety of teams in order to add the required logging throughout the codebase.
We also needed to track the currency, language and country a buyer is seeing on each pageview, along with their browser language settings so we could understand their preferred language. For this use case there was already some existing pageview logging, so we modified those events (to log the additional data shown in green) instead of adding new tracking. While “add some new fields” may sound trivial, it’s not. Those raw pageview events were an input to an existing data processing job, so we had to work closely with that data team to rebuild their dataset in order to add in these new fields. While most rebuilds are quick, this one took close to 6 months due to the data volumes (1 event for every pageview across nearly 2 million storefronts = very big data).
Getting data from our application databases
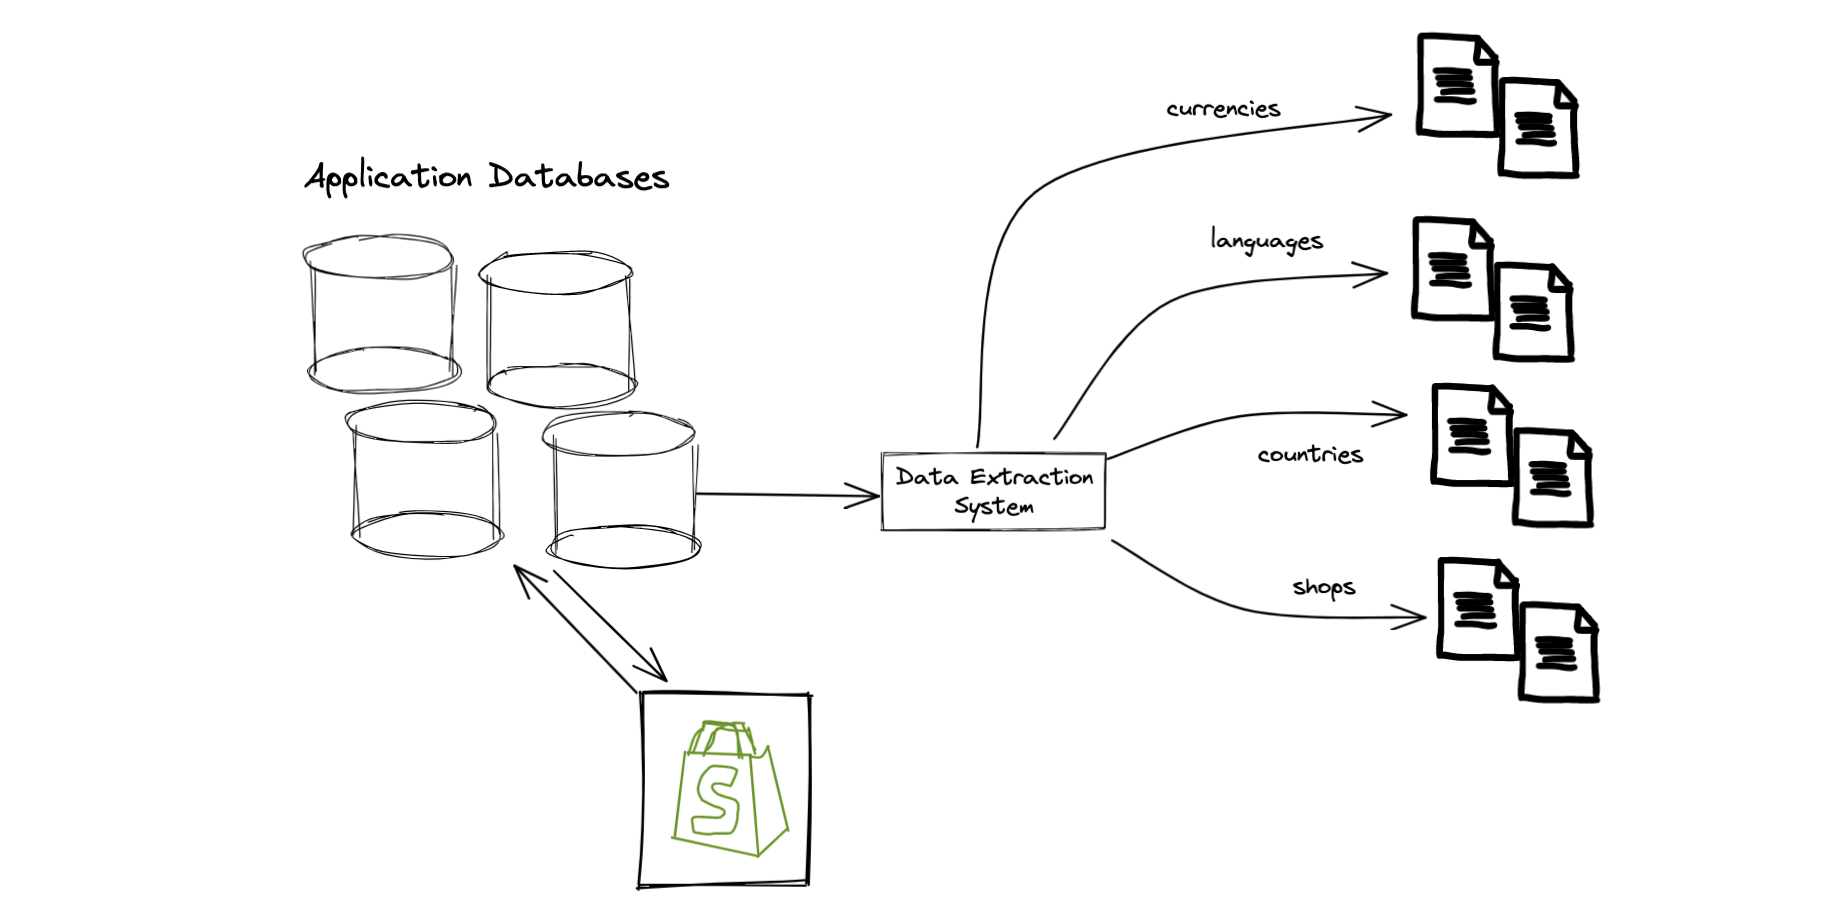
In addition to the new event tracking, we also had to get some information stored in our application databases. For this we used a data extraction system that makes copies of this data available for analytical purposes. In particular, we extracted:
- A copy of the
shopsmodel to get basic information about a shop (like what country they’re in, or the language of their store) - A copy of a
countriesdatabase, which includes useful information about a country like the default currency - A copy of our
currencyandlanguagemodels which tells us what alternate currencies or languages a shop has made available to their buyers
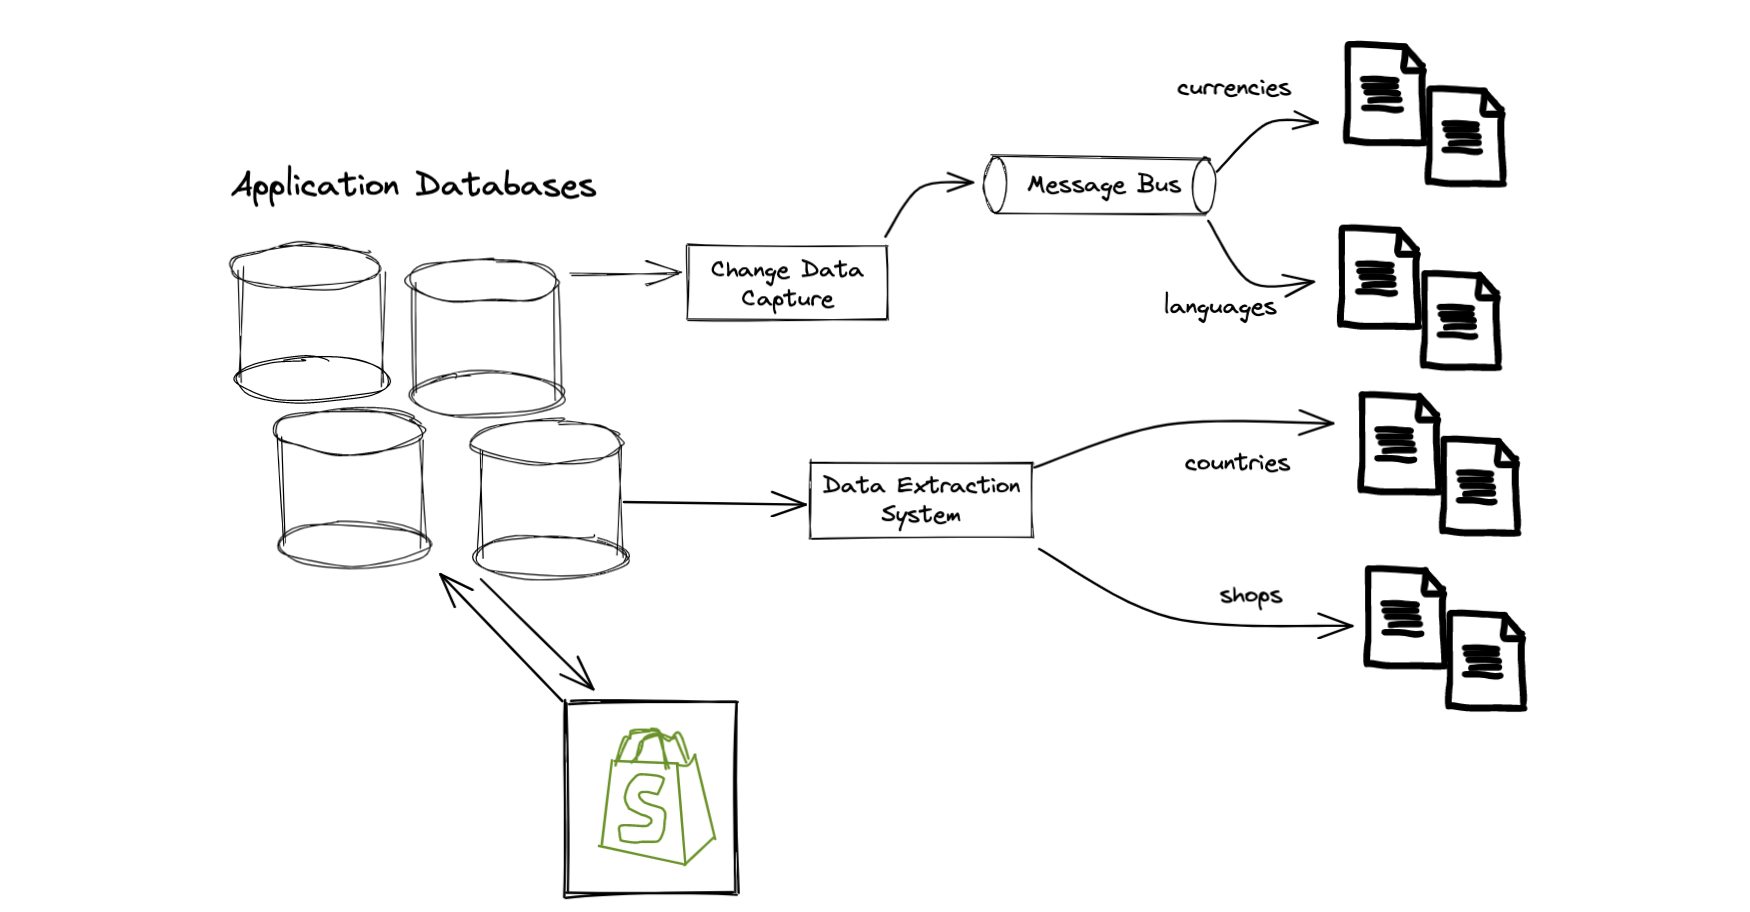
Sounds simple? Not quite. All of these models only tell us about the current state: “as of today, what alternate currencies does a shop have enabled”. To understand if international buyers could be localized, we actually must know what currencies / languages were available at the time the buyer visited to the store. To accomplish this, we needed to add new tracking to the application databases so we could understand state over time:
Processing
At this point we have a bunch of “raw datasets”: a collection of files1 in cloud storage. While some of these are directly usable, most need to be further refined to remove duplicates or be enhanced with additional information. Commence data processing:
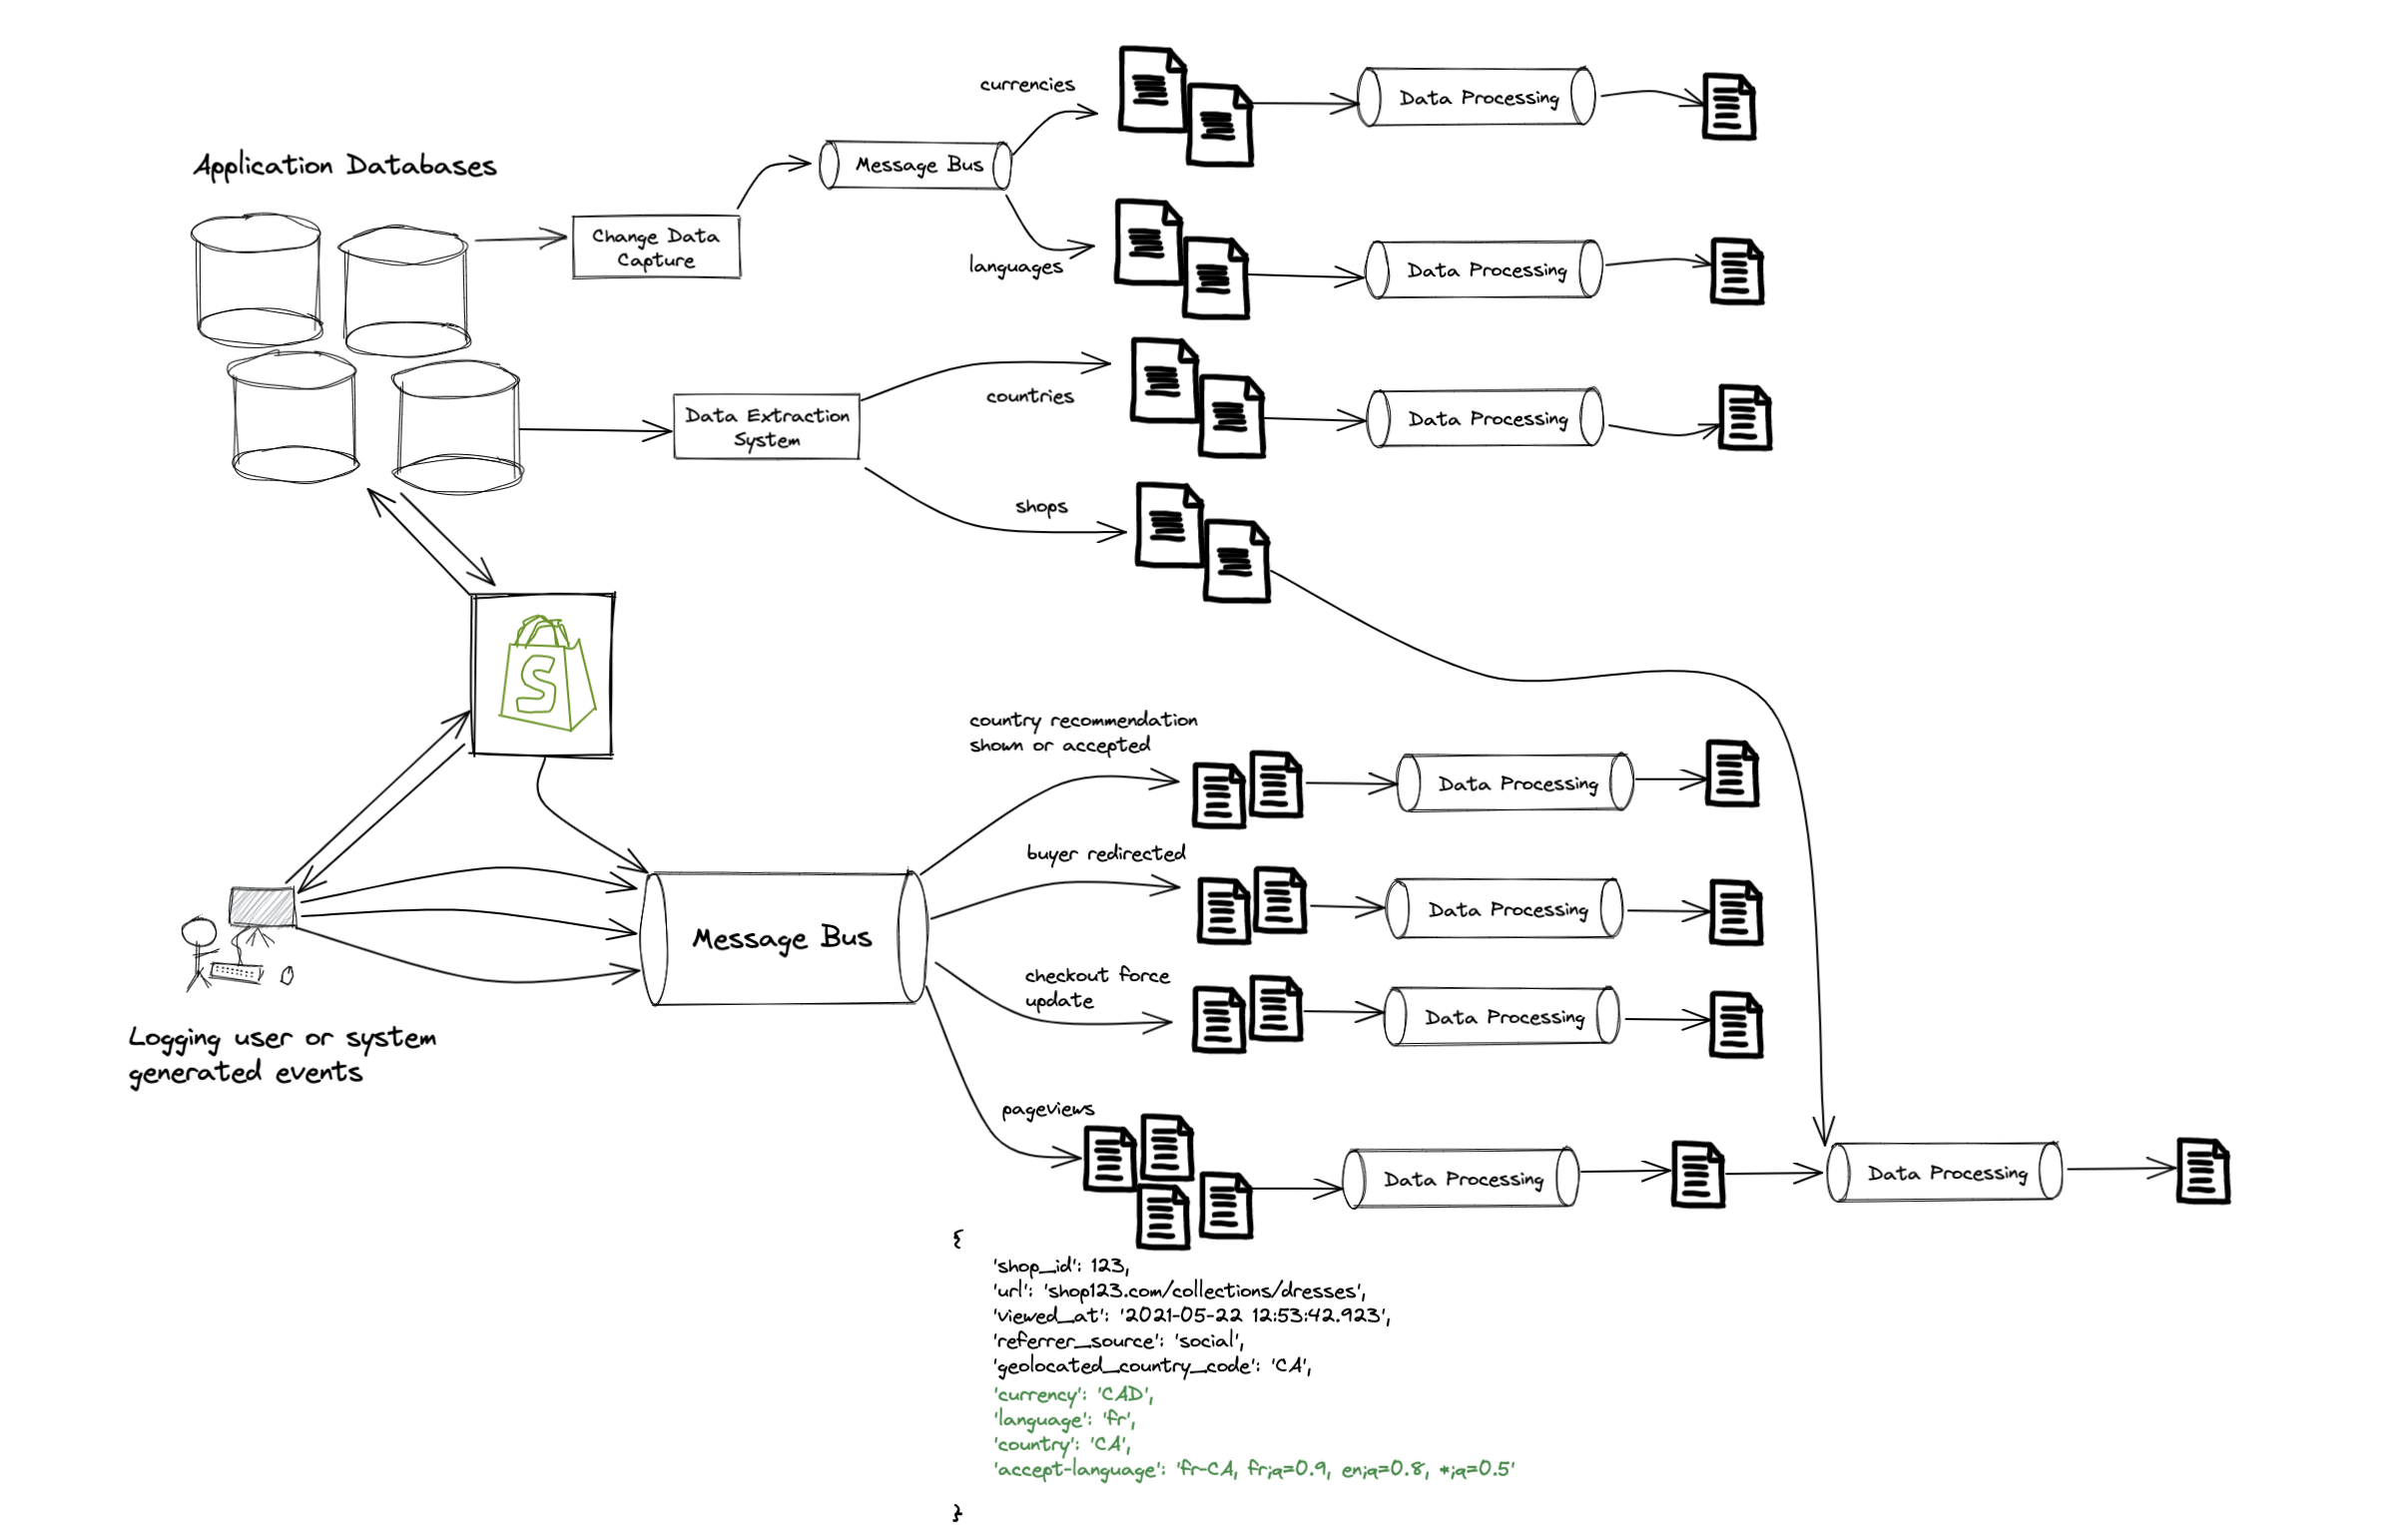
More processing
With these new datasets in place we finally had everything needed, and created one big processing job to combine all those inputs and output a new dataset with a bunch of useful metadata about the session2. With this in place, we could begin to answer the questions I discussed earlier for every buyer visit on a storefront.
but what’s going on in those pipes??
Great question! I’ve abstracted a lot of complexity in these diagrams by showing a simple “pipe” at each step: another black box that consumes data and spits out something else. Under the hood, we use Python and Apache Spark, a framework for distributed computing, to join & process all our datasets and encode the business logic we are interested in.
Correctly building and configuring these jobs can be a tricky process3 as you need to carefully tune the amount of compute (CPUs) and memory required by your job, along with both the sequence and way in which you process and combine your datasets.
Are we there yet?
Not quite. The last step outputted a dataset with 1 row per session, which will timeout if you try and query it directly in a dashboard since it’s too large. We needed to aggregate our dataset into something less granular. For this case we rolled it up to 1 row per shop, day, buyer country and referrer source, which results in a much smaller and faster dataset to query.
Okay, now we’re done. If we add up all the CPUs for the Spark jobs in each data processing step, there’s 1104 in total4!
Zooming out
As we zoom out, we can see that there’s actually quite a bit going on in that black box behind the dashboard…
Data is messy.
Data is hard.
Next time you look at a number or graph on a dashboard, appreciate the countless hours of work that went into producing it5. And of course, don’t forget the 1104 faithful CPUs relentlessly working behind the scenes to keep powering those pixels you look at each day.
Details for the curious
1 Our raw datasets are typically stored as Parquet files, but some of them are stored as gzipped text files, which are incredibly inefficient to query directly.
2 A “session” is just a collection of pageviews, typically bound by some time window. Conceptually, it represents someone “visiting” a store. It could end with a buyer leaving the store, or adding to their cart, or actually making a purchase.
3 This quote from Holden Karau in High Performance Spark summarizes it nicely:
Configuring a Spark job is as much an art as a science.
4 The number of CPUs (1104) is both an over estimate and an under estimate. An over estimate because not every dataset shown above is just used by that one dashboard we made. Instead, those CPUs are fueling an entire data ecosystem with a variety of use cases. It’s also an under estimate because I simply looked at the CPUs in each data processing step that uses Spark, because they are the most simple to measure and attribute. There are also a number of unaccounted CPUs required to power the different data extraction systems and message buses (Kafka) I showed in the diagrams.
5 This is easily one of the most complicated data models we’ve worked on, and one of the largest datasets we have to process. Not every dashboard will require this level of work (or compute), but most of them will share common elements like figuring out what data you need to collect, and least one layer of processing. It’s also worth noting that my team has been building many of these datasets over past few years, so not everything shown above happened at once.