
Lessons learned from online experiments
I’ve just wrapped up my 10th online experiment this week, so here’s 10 hard-earned lessons from the past year.
Randomization units
After launching our multi-currency functionality, our team wanted to measure the impact of our feature on the user experience, so we decided to run an experiment. I quickly decided that we randomly assign each session to test or control, and measure the impact on conversion (purchase) rates. We had a nicely modelled dataset at the session grain that was widely used for analyzing conversion rates, and consequently, the decision to randomize by session seemed obvious.
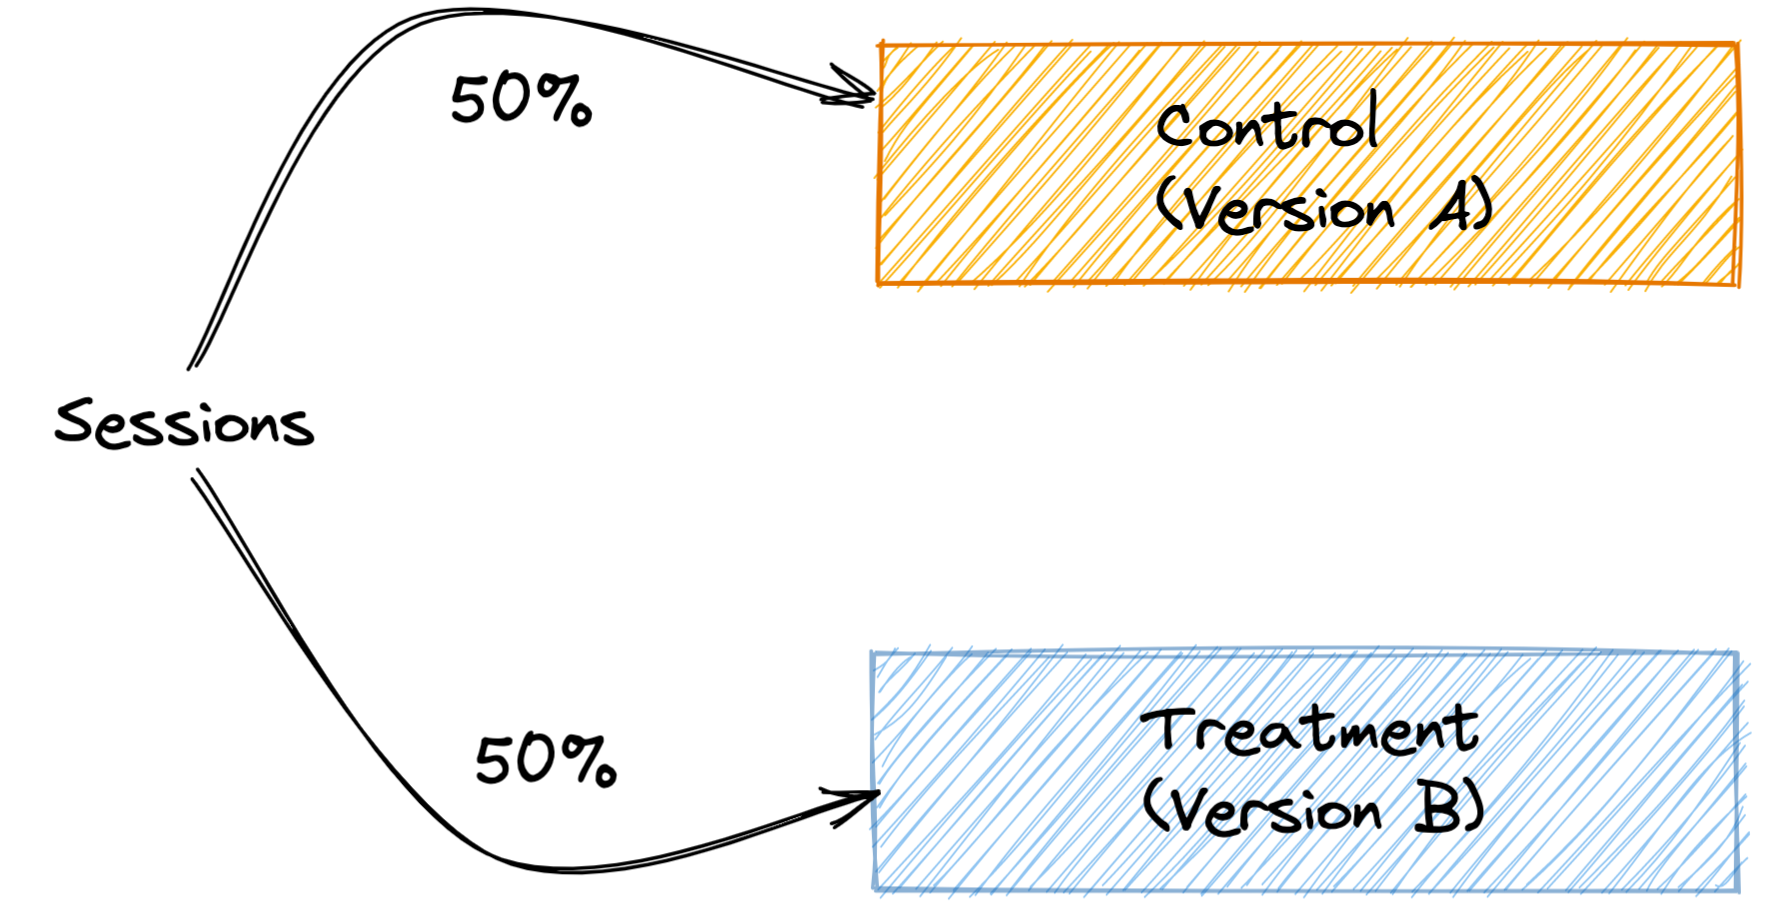
When you map out this setup, it looks something like the image below. Each session comes from some user, and we randomly assign their session to an experience. Our sessions are evenly split 50/50.
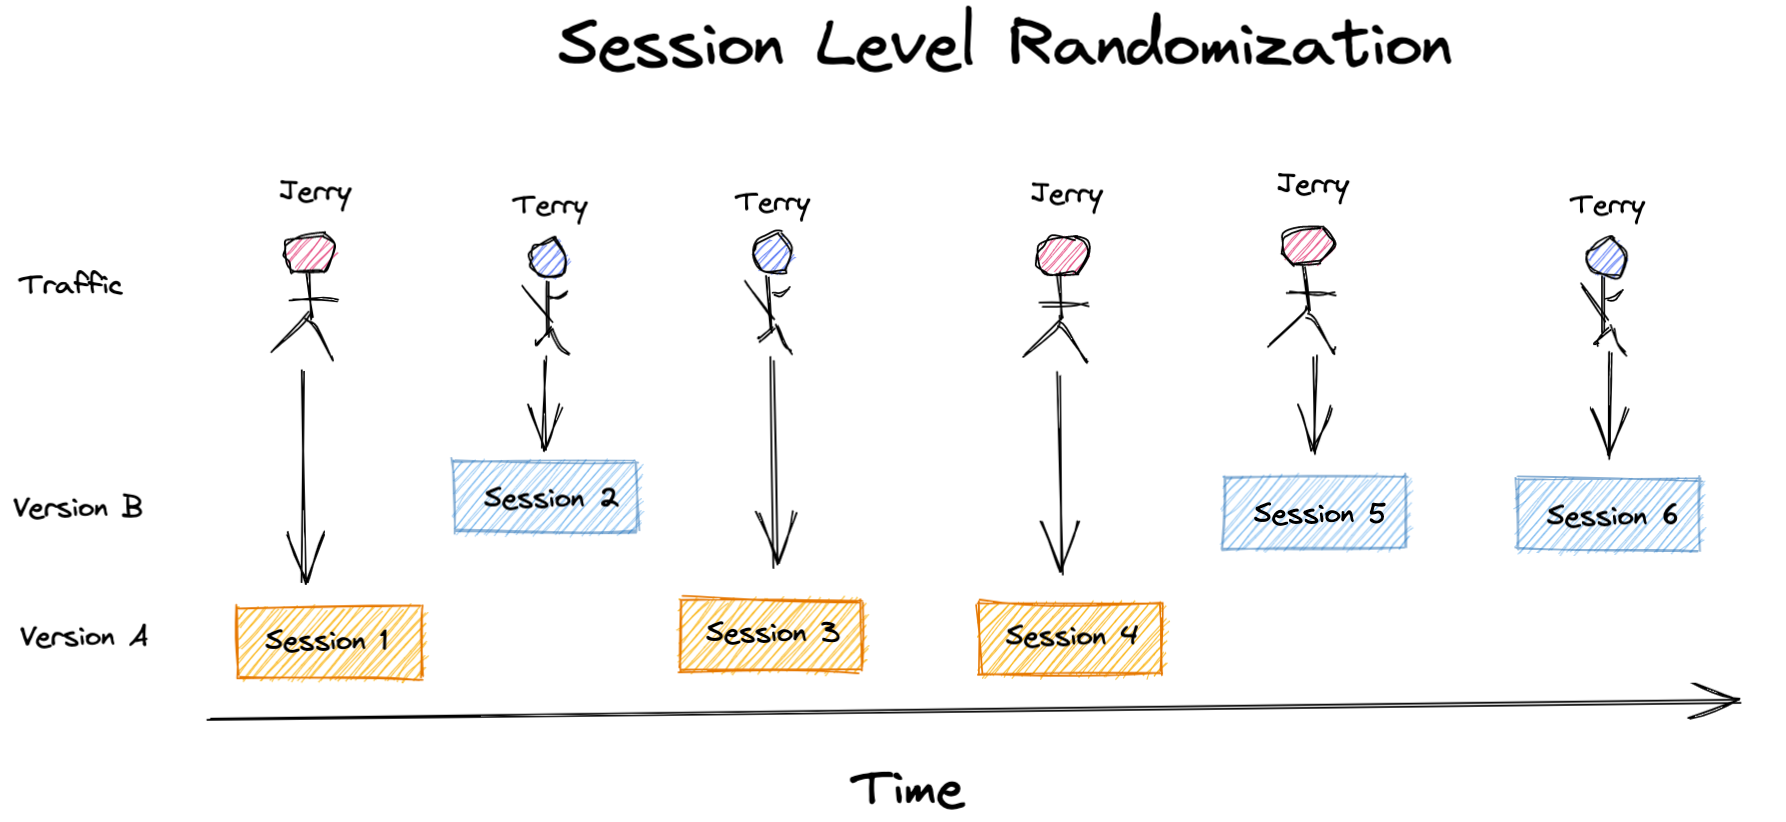
However, if you look a little closer, this setup could result in some users getting exposed to both experiences. It’s not uncommon for a user to have multiple sessions on a single store before they make a purchase.
If we look at our user Terry below, it’s not unrealistic to think that the “Version B” experience they had in Session 2 influenced their decision to eventually make a purchase in Session 3, which would get attributed to the “Version A” experience.
This led me to my first very valuable lesson that is to 💡think carefully when choosing your randomization unit. Randomization units should be independent, and if they aren’t, you may not be measuring the true effect of your change. Another factor in choosing your randomization unit comes from the desired user experience. You can imagine that it’s confusing for some users if something significant was visibly different each time they came to a website.1
Simulations are your friend
With the above tip in mind, we decided to switch to user level randomization for the experiment, while keeping the session conversion rate as our primary success metric since it was already modelled and there was a high degree of familiarity with the metric internally.
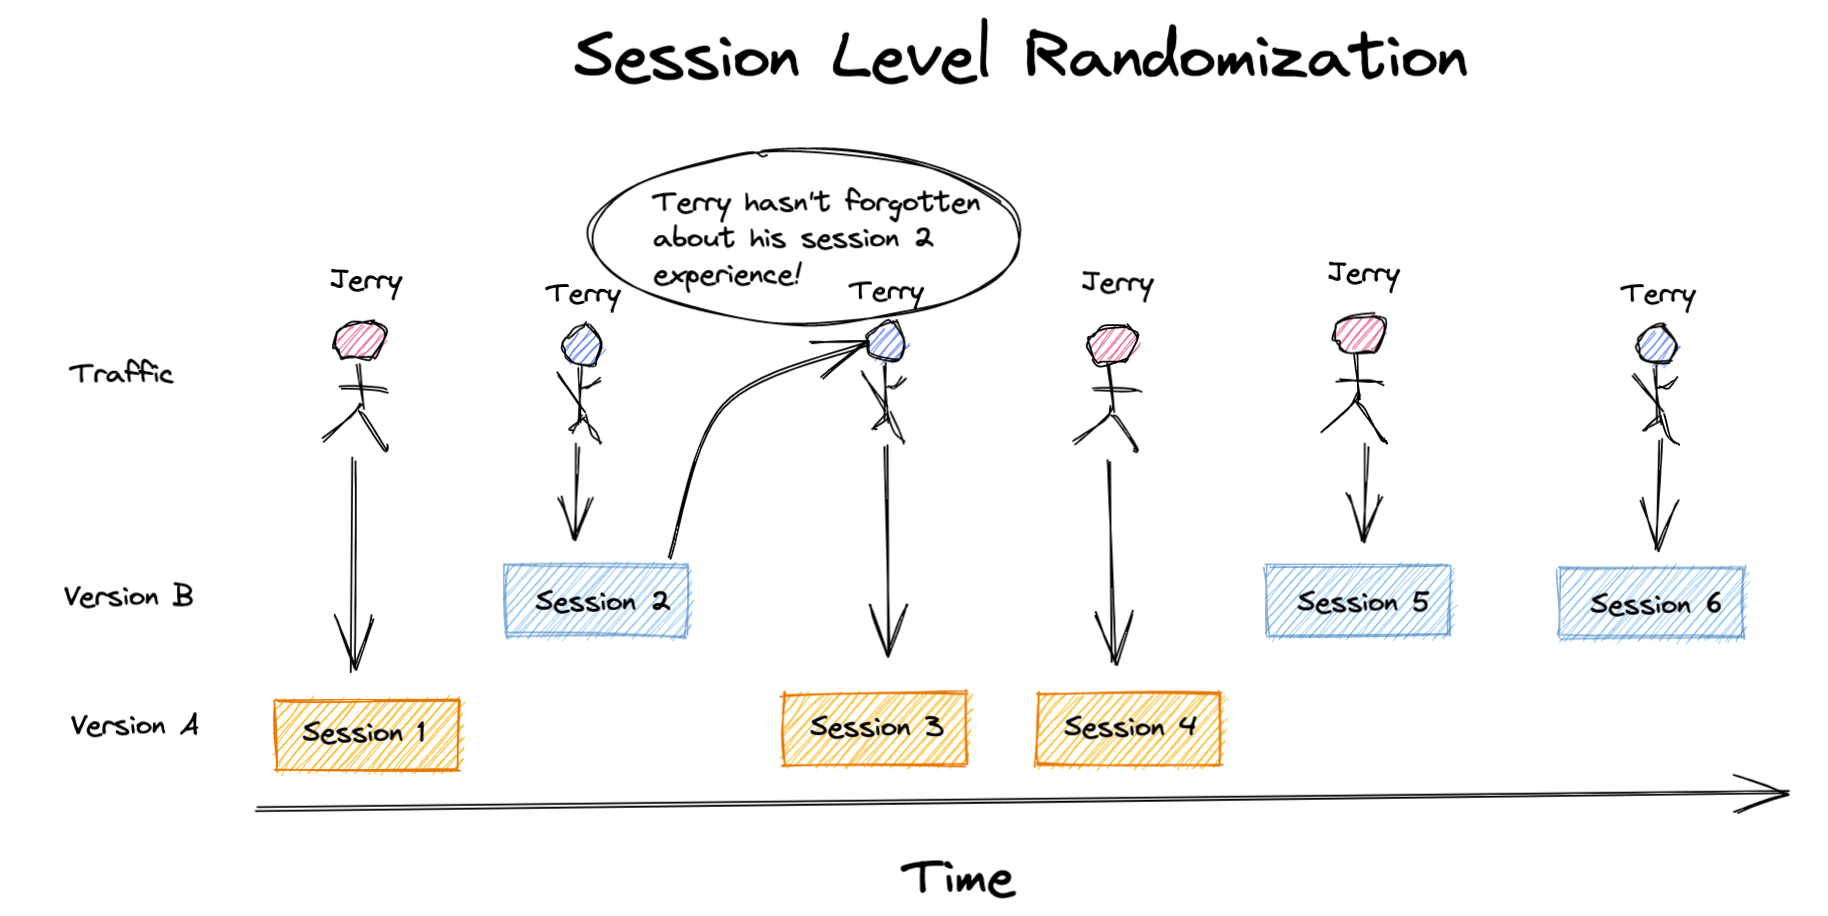
However, after doing some reading I discovered that having a randomization unit (user) that is different than your analysis unit (session) could lead to issues. In particular, there were some articles2 claiming that this could result in a higher rate of false positives. One of them showed a plot like this:
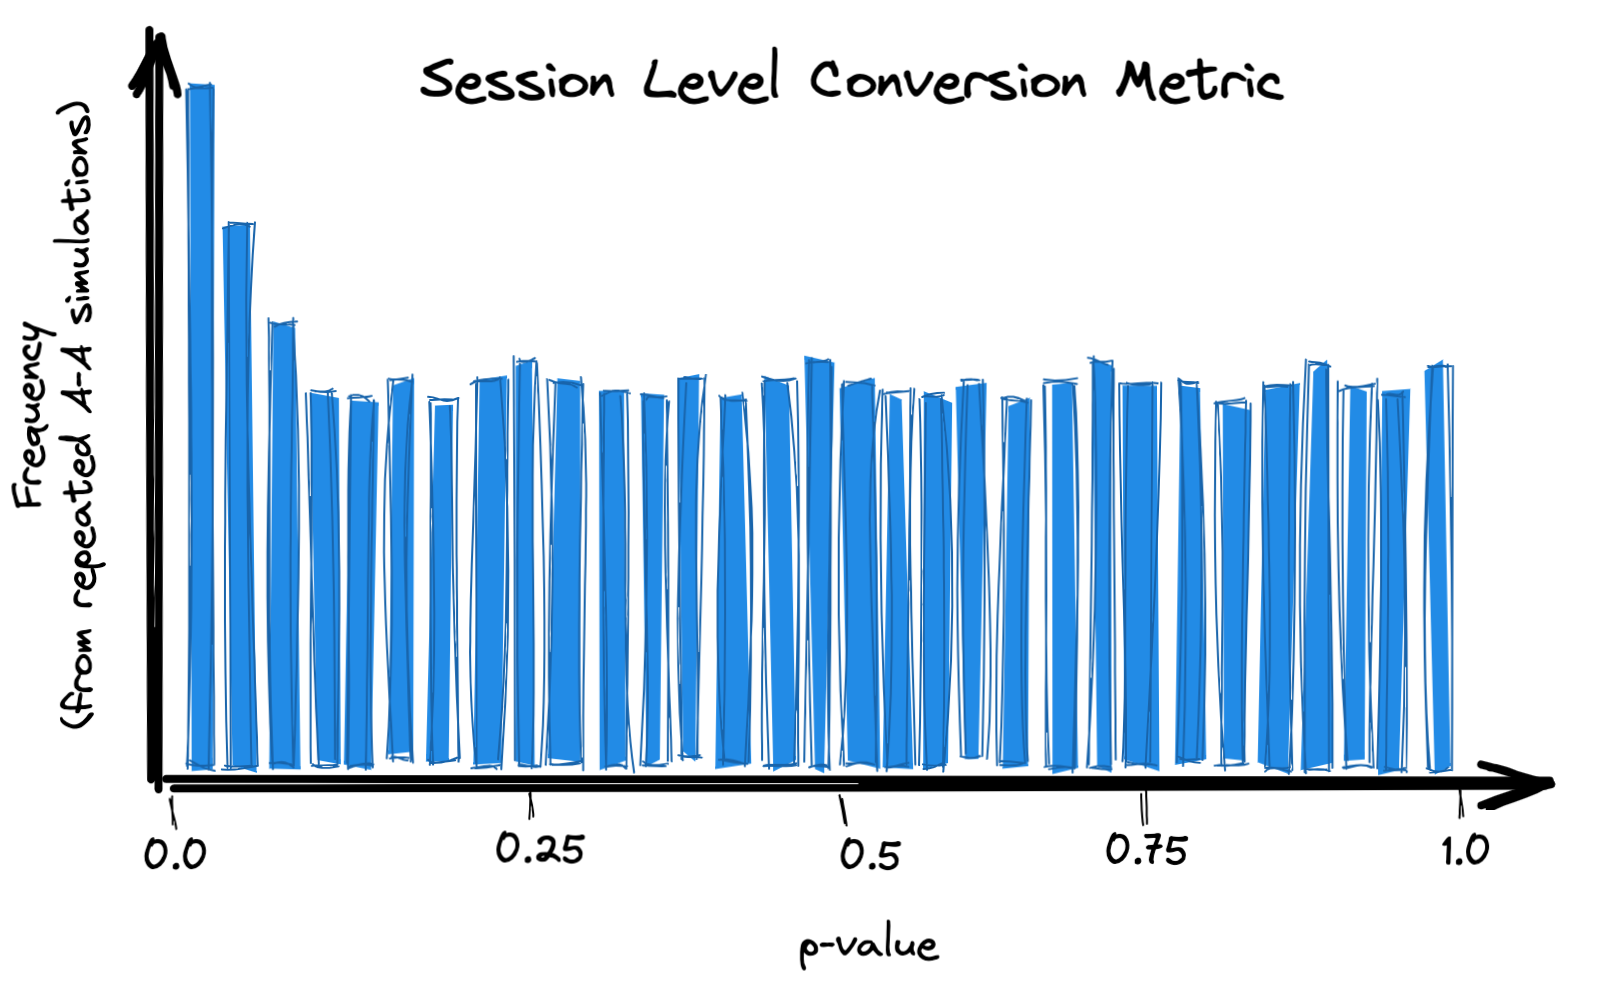
The intuition is that your results could be highly influenced by which users land in which group. If you have some users with a lot of sessions, and a really high or low session conversion rate, that could heavily influence the overall session conversion rate for that group.
Rather than throwing my hands up and changing the strategy, I decided to run a simulation to see if we would actually be impacted by this. The idea behind the simulation was to take our population and simulate many experiments where we randomized by user and compared session conversion rates like we were planning to do in our real experiment. I then checked if we saw a higher rate of false positives, and it turned out we didn’t so we decided to stick with our existing plan.3
The key lesson here was that 💡simulations are your friend. If you’re ever unsure about some statistical effect, it’s very quick (and fun) to run a simulation to see how you’d be affected, before jumping to any conclusions.
Influencing small decisions
Data is commonly used to influence big decisions with an obvious need for quantitative evidence. Does this feature positively impact our users? Should we roll it out to everyone? But there’s also a large realm of much smaller decisions that can be equally influenced by data.
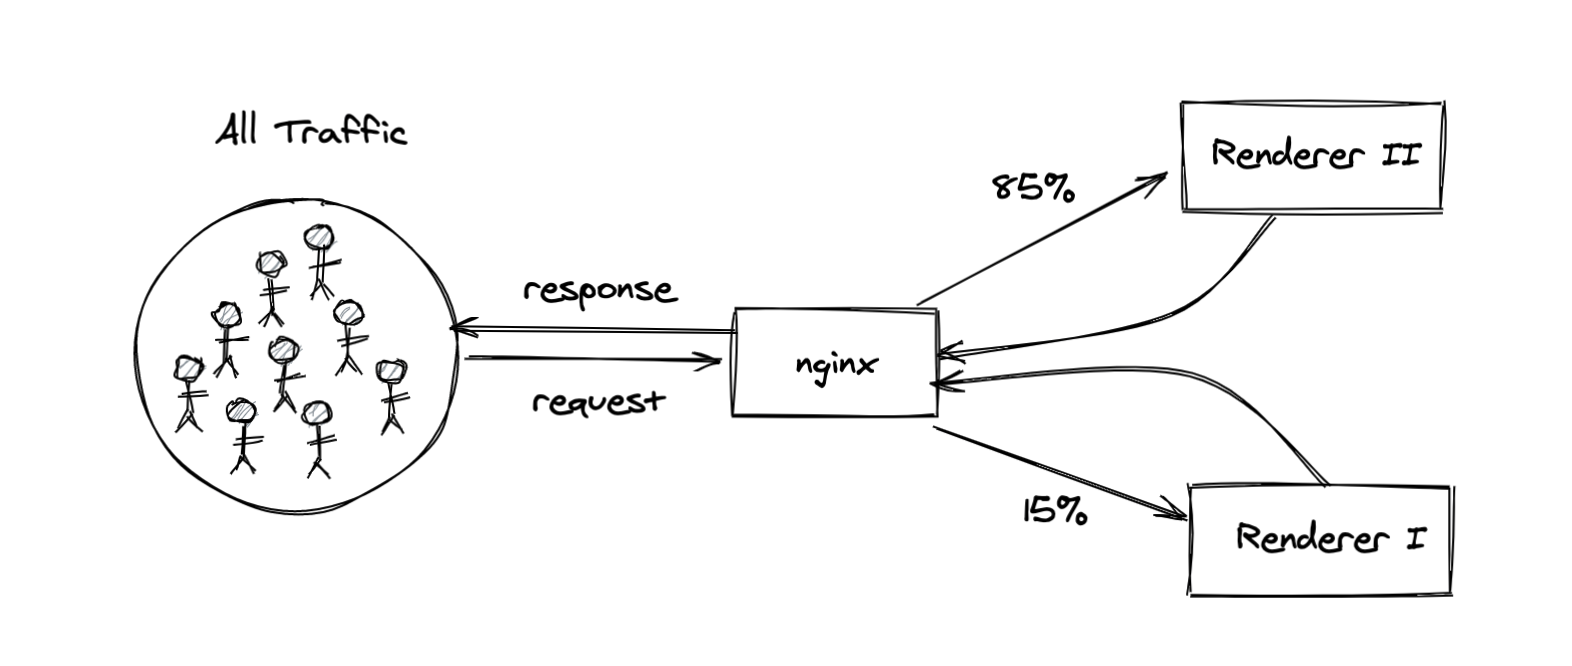
Around the time we were planning an experiment to test a new design for our geolocation recommendations, the system responsible for rendering the relevant website content was in the process of being upgraded. The legacy system (“Renderer 1”) was still handling approximately 15 percent of the traffic, while the new system (“Renderer 2”) was handling the other 85 percent. This posed a question to us: do we need to implement our experiment in the two different codebases for each rendering system? Based on the sizable 15 percent still going to “Renderer 1”, our initial thinking was yes. However, we decided to dig a bit deeper.
With our experiment design, we’d only be giving the users the treatment or control experience on the first request in a given session. With that in mind, the question we actually needed to answer changed. Instead of asking what percent of all requests across all users are served by “Renderer 2”, we needed to look at what percent of first requests in a session are served by “Renderer 2” for the users we planned to include in our experiment.
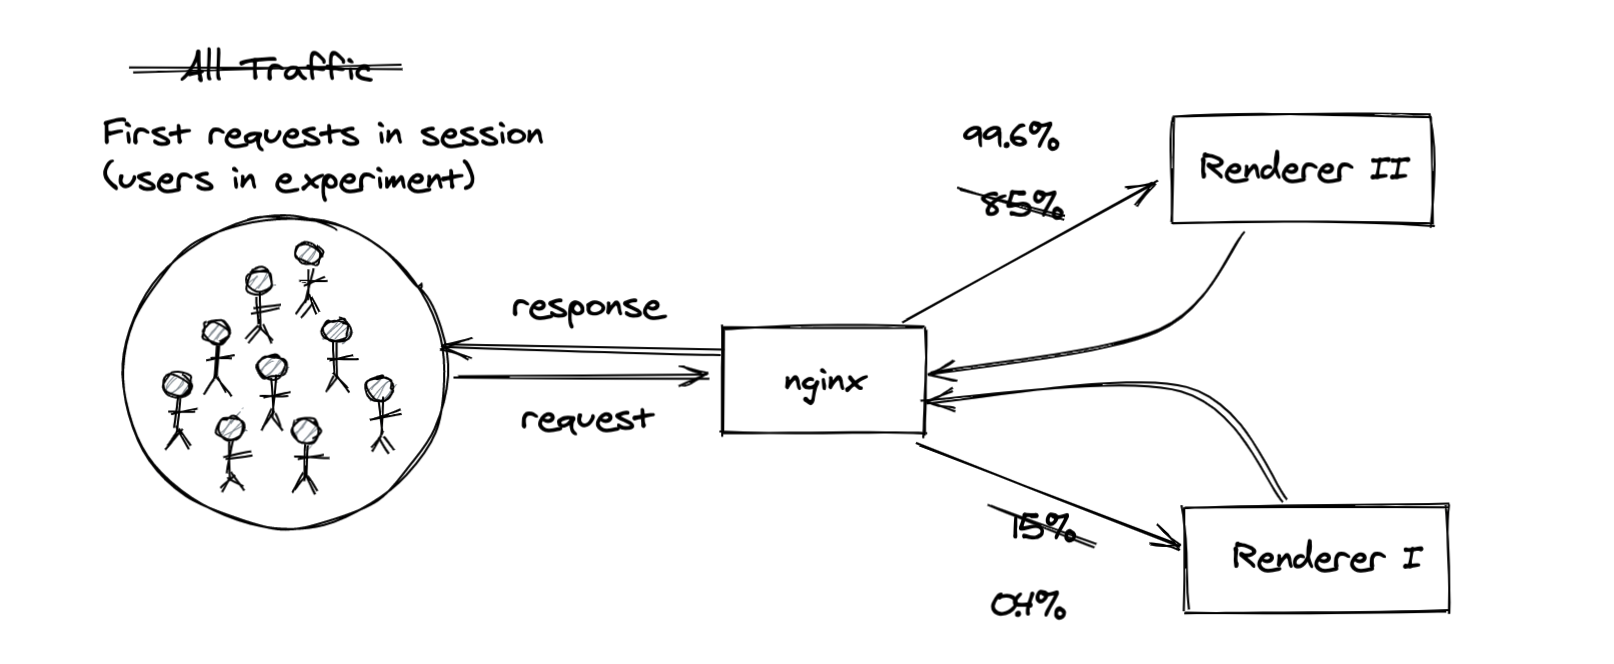
By reframing the problem, we learned that almost all of the relevant requests were being served by the new system, so we were safe to only implement our experiment in one code base.
A key lesson learned from this was that 💡data can and should inform both big & small decisions. Big decisions like “should we roll out this feature to all users”, and small decisions like “should we spend a few days implementing our experiment logic in another codebase”. In this case, two hours of scoping saved at least two days of engineering work, and we learned something useful in the process.
This lesson wasn’t necessarily unique to this experiment, but it’s worth reinforcing. You can only identify these opportunities when you’re working very closely with your cross-discipline counterparts (engineering in this case), attending their standups, and hearing the decisions they’re trying to make. They usually won’t come to you with these questions as they may not think that this is something data can easily or quickly solve.
Understanding the system
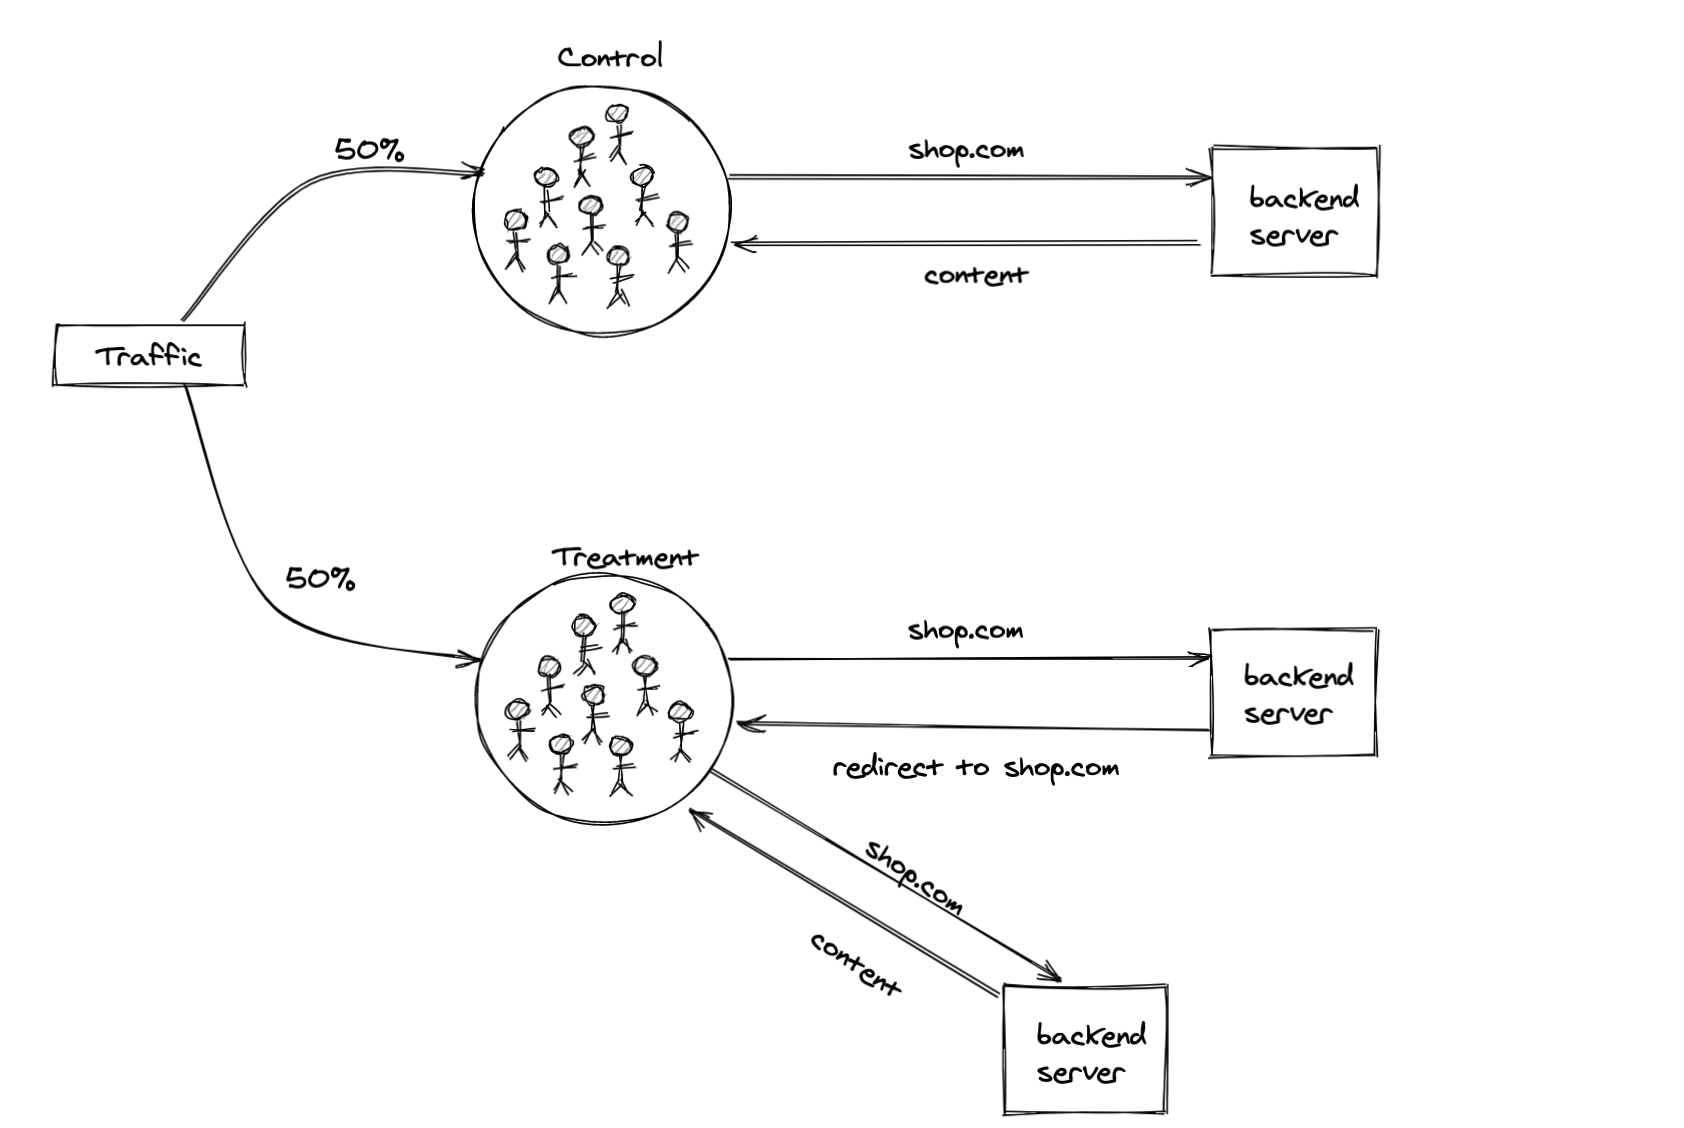
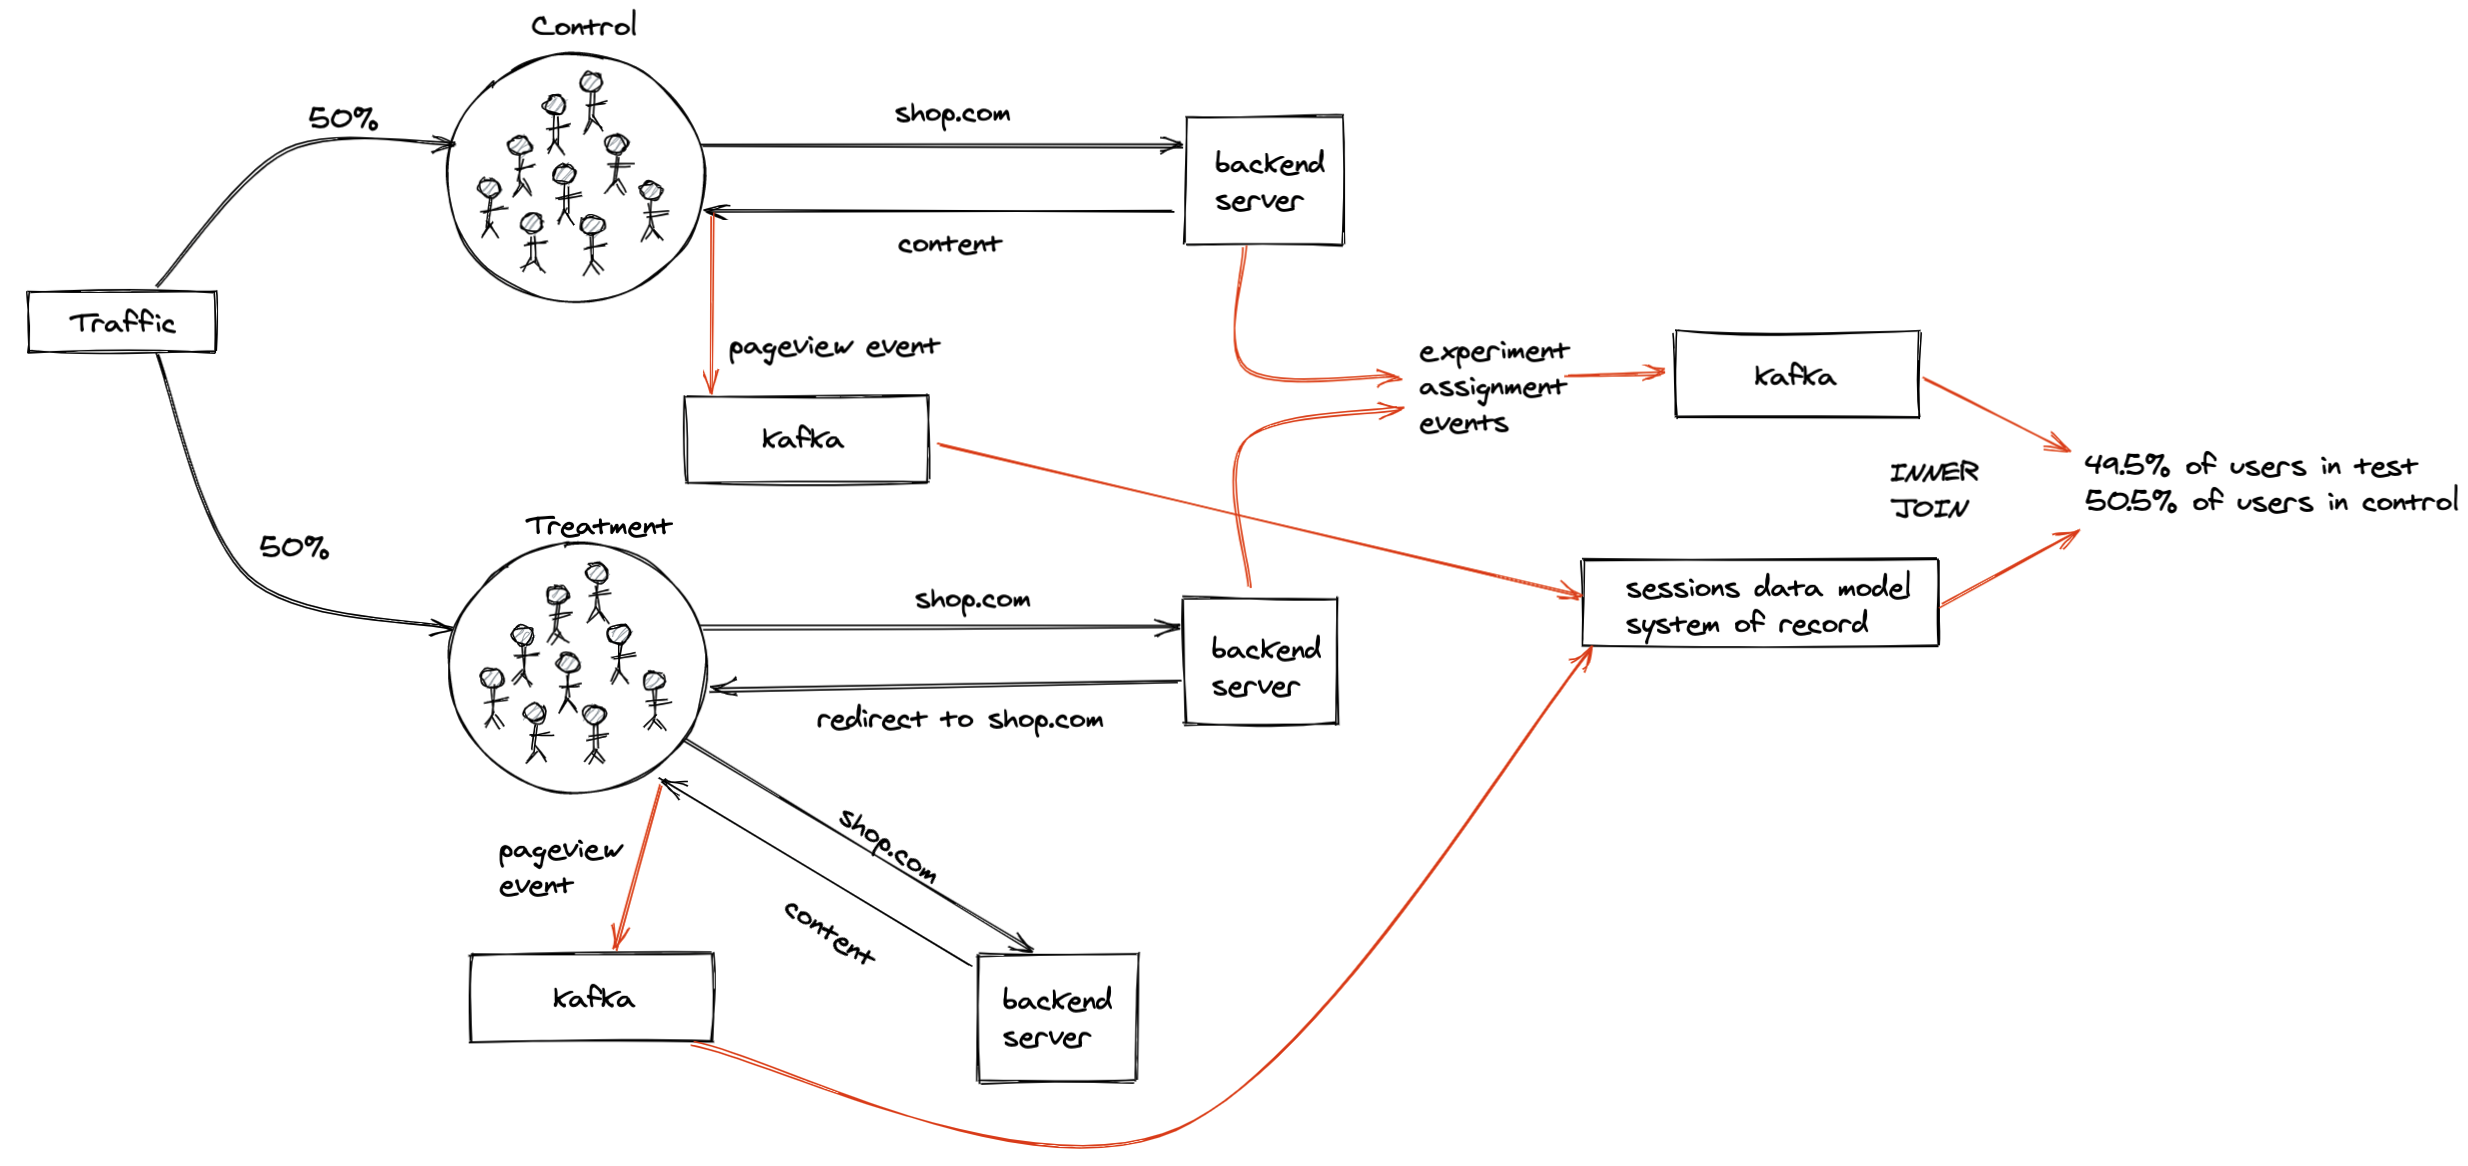
For an experiment that involved redirecting the treatment group to a different URL, we decided to first run an A/A’ test to validate that redirects were working as expected and not having a significant impact on our metrics.4
The A/A’ setup looked something like this:
- A request for a URL comes into the backend
- The user, identified using a cookie, is assigned to control / treatment
- The user & their assigned group is asychronously logged to Kafka
- If the user is in the control group they receive the rendered content (html, etc.) they requested
- If the user is in the treatment group, the server instead responds with a 302 redirect to the same URL
- This causes the user in the treatment group to make another request for the same URL
- This time the server responds with the rendered content originally requested (a cookie is set in the previous step to prevent the user from being redirected again)
This may look like a lot, but for users this is virtually invisible. You’d only know if you were redirected if you opened your browser developer tools (under the “Network” tab you’ll see a request with a 302 status).
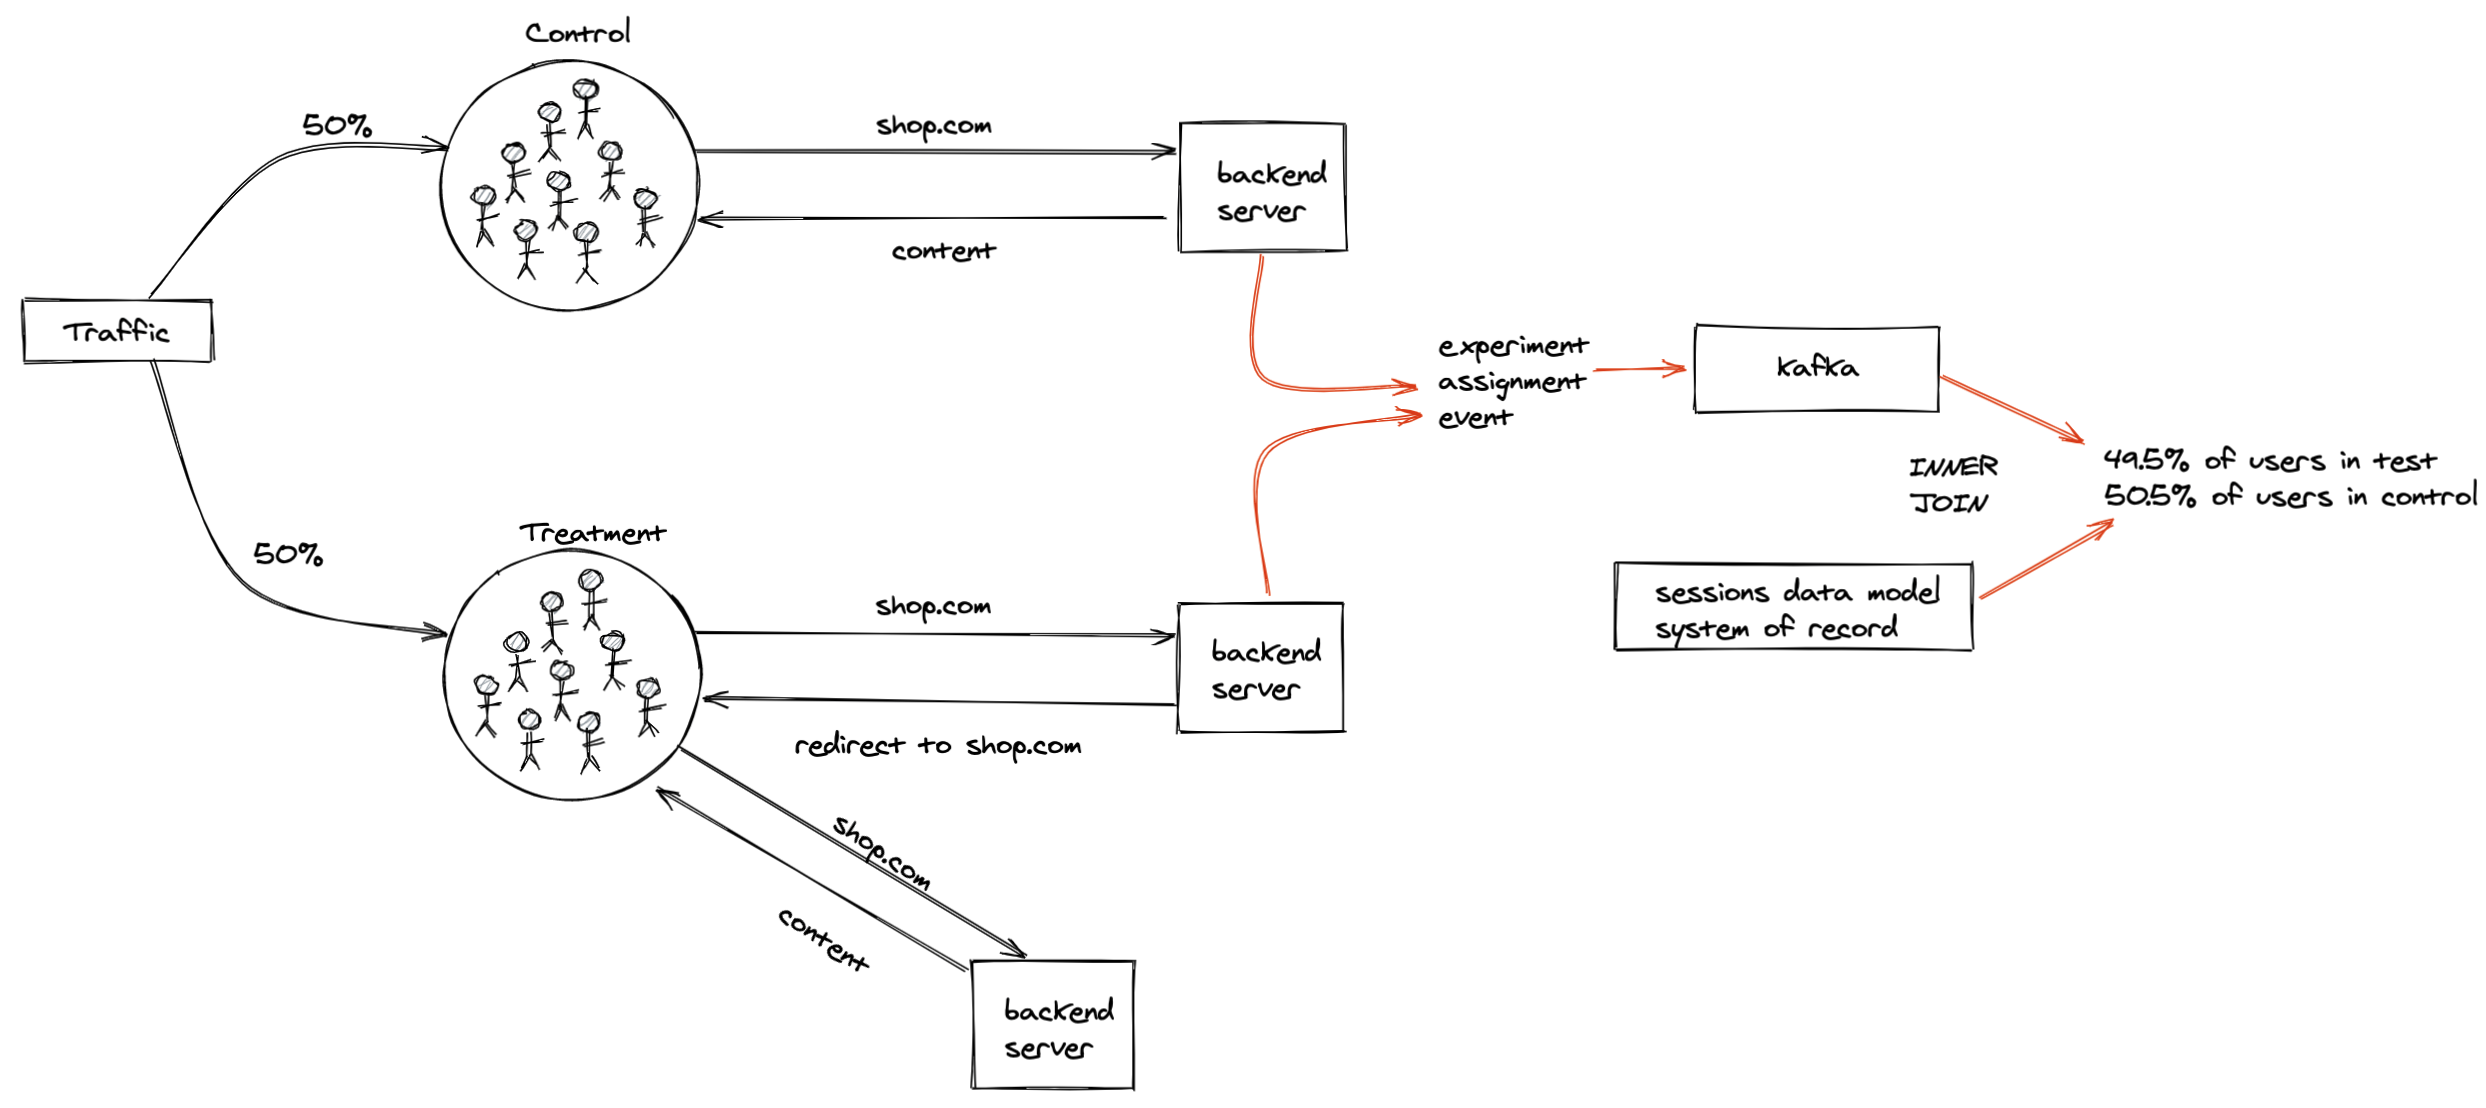
Shortly into the experiment, I encountered my first instance of sample ratio mismatch (SRM). SRM is when the number of subjects in each group doesn’t match your expectations.
After “inner joining” the assigned users to our sessions system of record, we were seeing a slightly lower fraction of users in the test group compared to the control group instead of the desired 50/50 split.
We asked ourselves why this could be happening. And in order to answer that question, we needed to understand how our system worked. In particular, how do records appear in the sessions data model, and what could be causing fewer records from our test group to appear in there?
After digging through the source code of the sessions data model, I learned that it’s built by aggregating a series of pageview events. These pageview events are emitted client side, which means that the “user” needs to download the html and javascript content our servers return, and then they will emit the pageview events to Kafka.
With this understanding in place, I now knew that some users in our test group were likely dropping off after the redirect and consequently not emitting the pageview events.
To better understand why this was happening, we added some new server-side logging for each request to capture some key metadata. Our main hypothesis was that this was being caused by bots, since they may not be coded to follow redirects. Using this new logging, I tried removing bots by filtering out different user agents and requests coming from certain IP addresses. This helped reduce the degree of SRM, but didn’t entirely remove it. It’s likely that I wasn’t removing all bots (as they’re notoriously hard to identify) or there were potentially some real users (humans) who were dropping off in the test group. Based on these results, I ended up changing the data sources used to compute our success metric and segment our users.
Despite the major head scratching this caused, I walked away with some really important lessons:
- 💡Develop a deep understanding of your system. By truly understanding how redirects and our sessions data model worked, we were able to understand why we were seeing SRM and come up with alternatives to get rid of it.
- 💡Log generously. Our data platform team made it incredibly simple and low effort to add new Kafka instrumentation, so we took advantage. The new request logging we initially added for investigative purposes ended up being used in the final metrics.
- 💡Run more A/A tests. By running the A/A test, I was able to identify the sample ratio mismatch issues and update our metrics and data sources prior to running the final experiment. We also learned the impact of redirection alone that helped with the final results interpretation in the eventual A/B test where we had redirection to a different URL.5
Peeking
In one experiment where we were testing the impact of translating content into a buyer’s preferred language, I was constantly peeking at the results each day as I was particularly interested in the outcome. The difference in the success metric between the treatment and control groups had been holding steady for well over a week, until it took a nose dive in the last few days of the experiment.
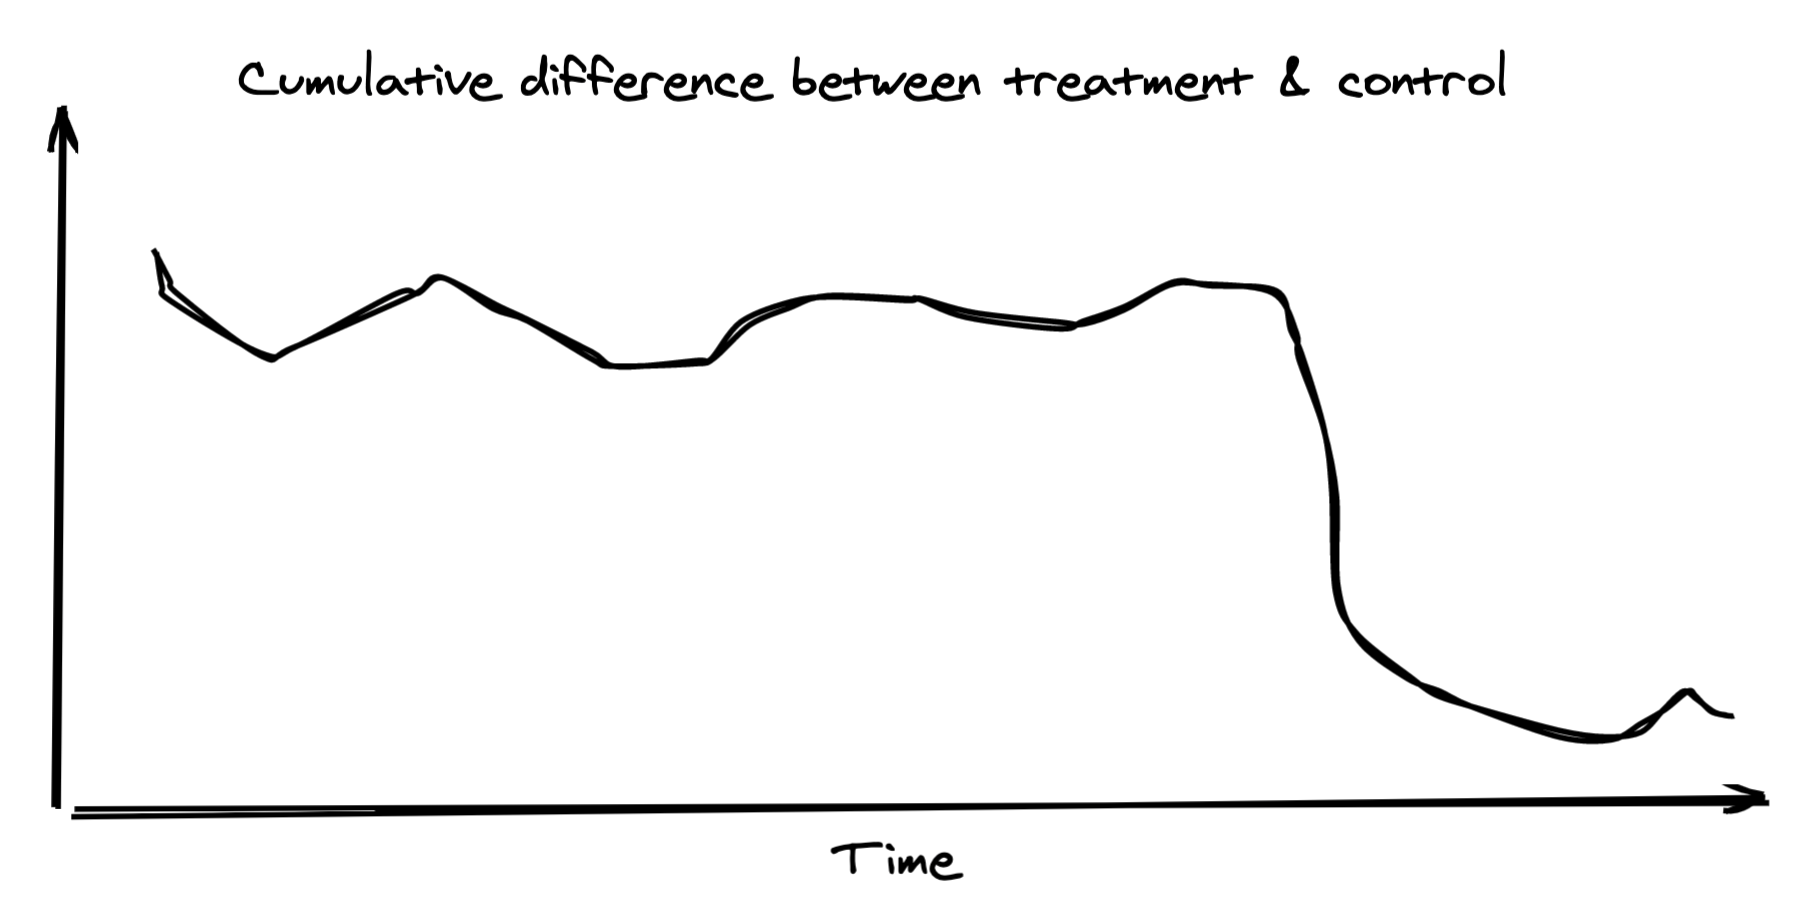
After digging into the data, I found that this change was entirely driven by a single store with abnormal activity and very high volumes, causing it to heavily influence the overall result. This served as a pleasant reminder to 💡beware of user skew. With any rate based metric, your results can easily be dominated by a set of high volume users (or in this case, a single high volume store).
And despite the warnings you’ll hear, 💡peeking is good. Peeking at the results each day allowed me to spot the sudden change in our metrics, and subsequently identify & remove the offending outlier.6
Rabbit holes
In another experiment involving redirects, I was once again experiencing SRM. There was a higher than expected number of sessions in one group. In past experiments, similar SRM issues were found to be caused by bots not following redirects or weird behaviour with certain browsers.
I was ready to chalk up this SRM to the same causes and call it a day, but there was some evidence that hinted something else may be at play. As a result, I ended up going down a big rabbit hole. The rabbit hole eventually led me to review the application code and our experiment qualification logic. I learned that users in one group had all their returning sessions disqualified from the experiment due to a cookie that was set in their first session.
For an ecommerce experiment, this has significant implications since returning users (buyers) are much more likely to purchase. It’s not a fair comparison if one group contains all sessions, and the other only contains the buyer’s first sessions. The results of the experiment changed from negative to positive overall after switching the analysis unit from session to user so that all user’s sessions were considered.
Another important lesson learned: 💡go down rabbit holes. In this case, the additional investigation turned out to be incredibly valuable as the entire outcome of the experiment changed after discovering the key segment that was inadvertently excluded. The outcome of a rabbit hole investigation may not always be this rewarding, but at minimum you’ll learn something you can keep in your cognitive backpack.
We are measuring averages
Oftentimes it may be tempting to look at your overall experiment results across all segments and call it a day. Your experiment is positive overall and you want to move on and roll out to the feature. This is a dangerous practice, as you can miss some really important insights.
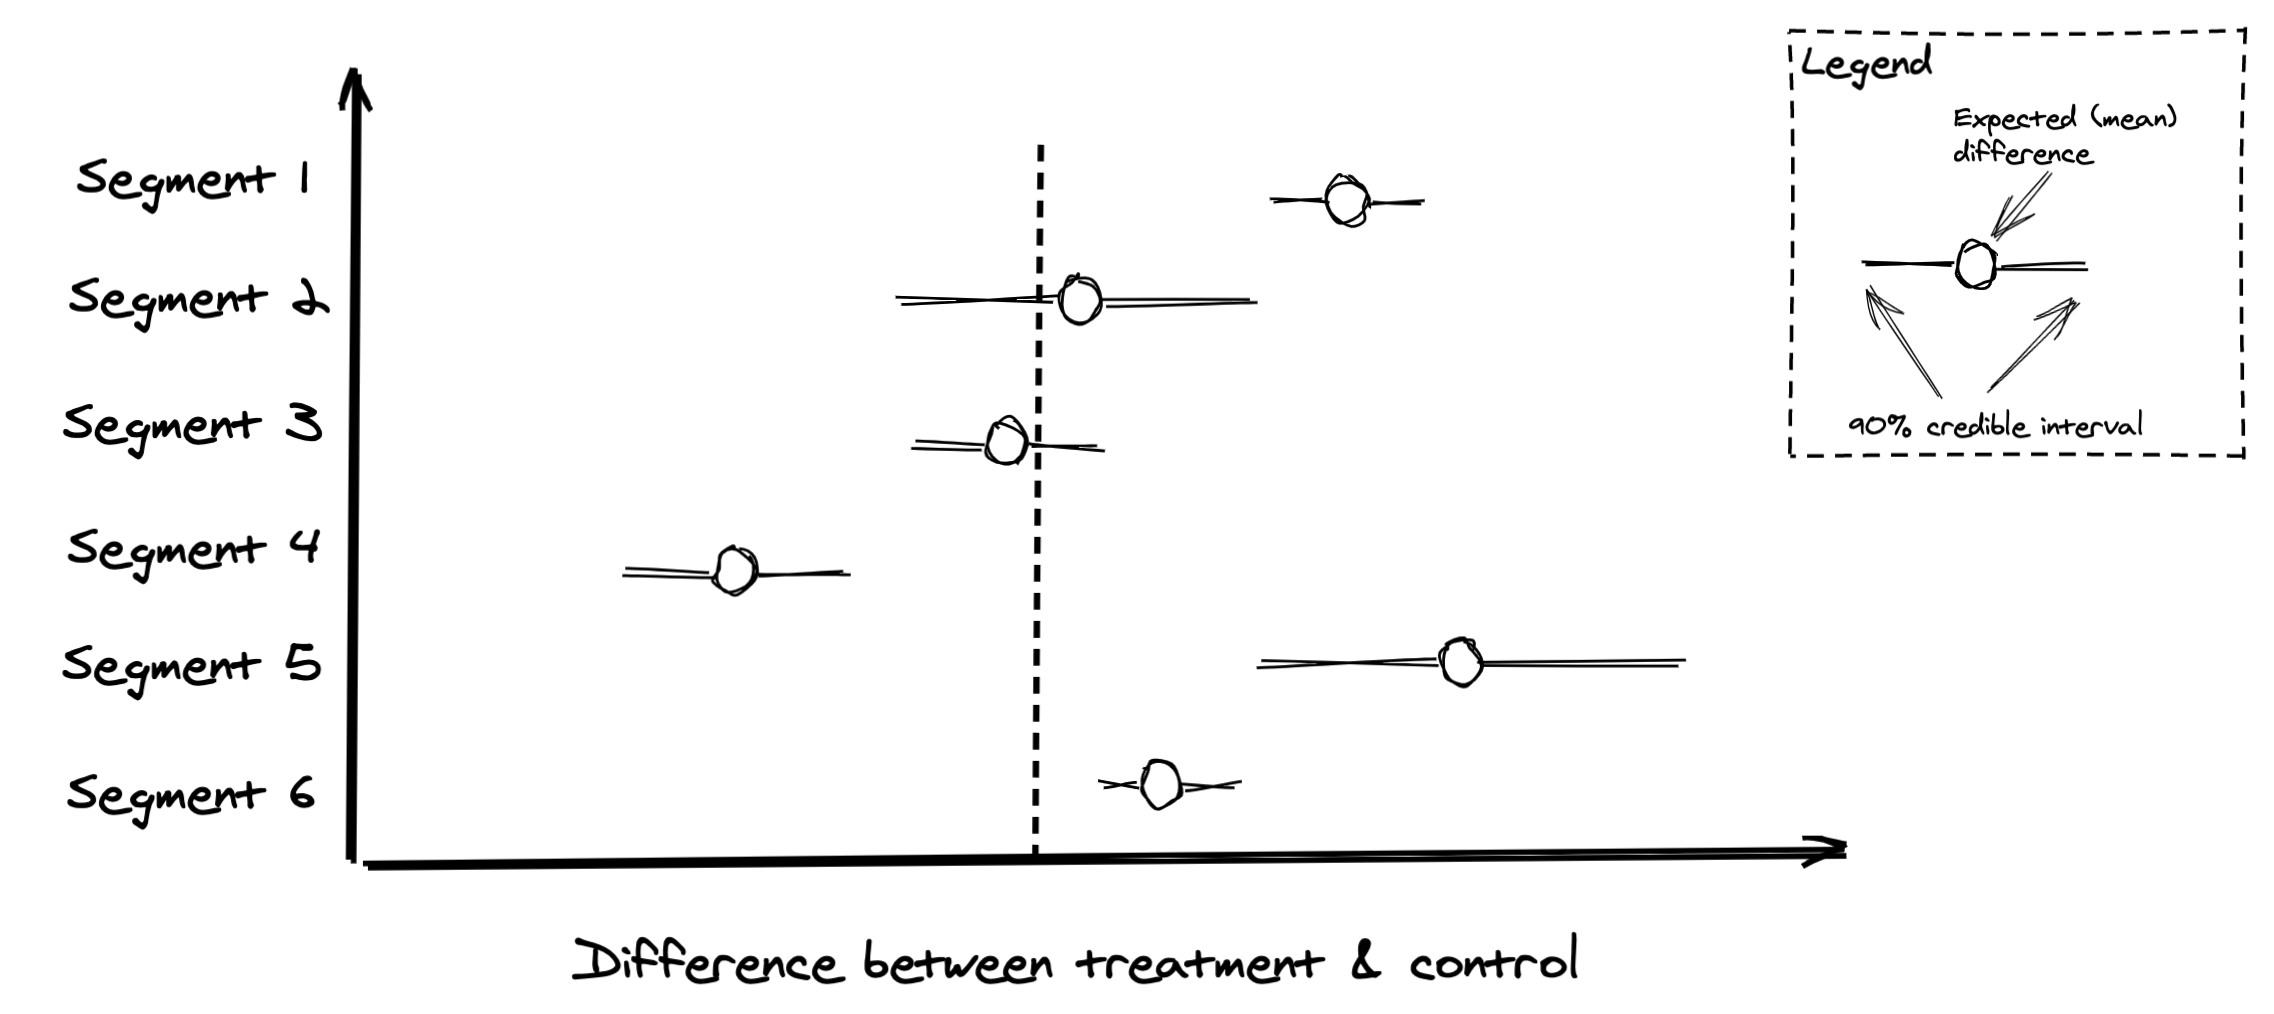
As we report results across all segments, it’s important to remember that 💡we are measuring averages. Positive overall doesn’t mean positive for everyone and vice versa. Always slice your results across key segments and look at the results. This can identify key issues like a certain browser or device where your design doesn’t work, or a buyer demographic that’s highly sensitive to the changes. These insights are just important as the overall result, as they can drive product changes or decisions to mitigate these effects.
Going forward…
So as you run more experiments, remember:
- 💡Think carefully when choosing your randomization unit
- 💡Simulations are your friend
- 💡Data can, and should inform both big & small decisions
- 💡Develop a deep understanding of your system
- 💡Log generously
- 💡Run more A/A tests
- 💡Peeking is good
- 💡Beware of user skew
- 💡Go down rabbit holes
- 💡We are measuring averages
I certainly will.
Notes
1 For a more involved discussion on choosing your randomization unit, check out this post.
2 This medium article first made me aware of the issue. It is also discussed in Chapter 18 of Trustworthy Online Controlled Experiments.
3 You can consult this post to learn more about when you can expect a higher rate of false positives when your randomization unit is different than the analysis unit, and how to deal with it when you are affected.
4 Kohavi & Longbotham discuss experiments involving redirects in this paper, and how it is important to run an A/A test (or rather, A/A’ test, where A’ uses a redirect) prior to the A/B test.
5 I’ve written a separate post on running A/A tests for those who are interested in learning more.
6 By peeking is good I mean looking at your results throughout the course of the experiment. To avoid the peeking problems most people are aware of, this can only be done in conjunction with following a strict experiment plan to collect a pre-determined sample size (i.e. don’t get excited by the results and end the experiment early).