Choosing your randomization unit in online A/B tests
Despite being considered the gold standard approach for determining the true effect of a change, there are still many statistical traps & biases that can spring up when A/B tests are not set up correctly. This post will discuss some of the nuances you must consider when choosing a randomization unit for your A/B test.
Background
In A/B tests, or “experiments”, one group is typically shown the original variant, the “control”, and the other group is shown the new variant which differs to some degree from the control. We often say this group received the “treatment” - presumably due to the extensive usage of A/B tests in drug trials.
A key decision you must make with any A/B test is how you create these two groups. I’ll use an e-commerce website as an example throughout the remainder of this post, but the concepts will readily apply to any type of website or user facing application.
Let’s say you want to test out two different versions of your e-commerce website, and determine which option is better for your business. We know we need to randomly divide our population into two equally sized groups, and give each of those groups a different experience. But how should it be split up?
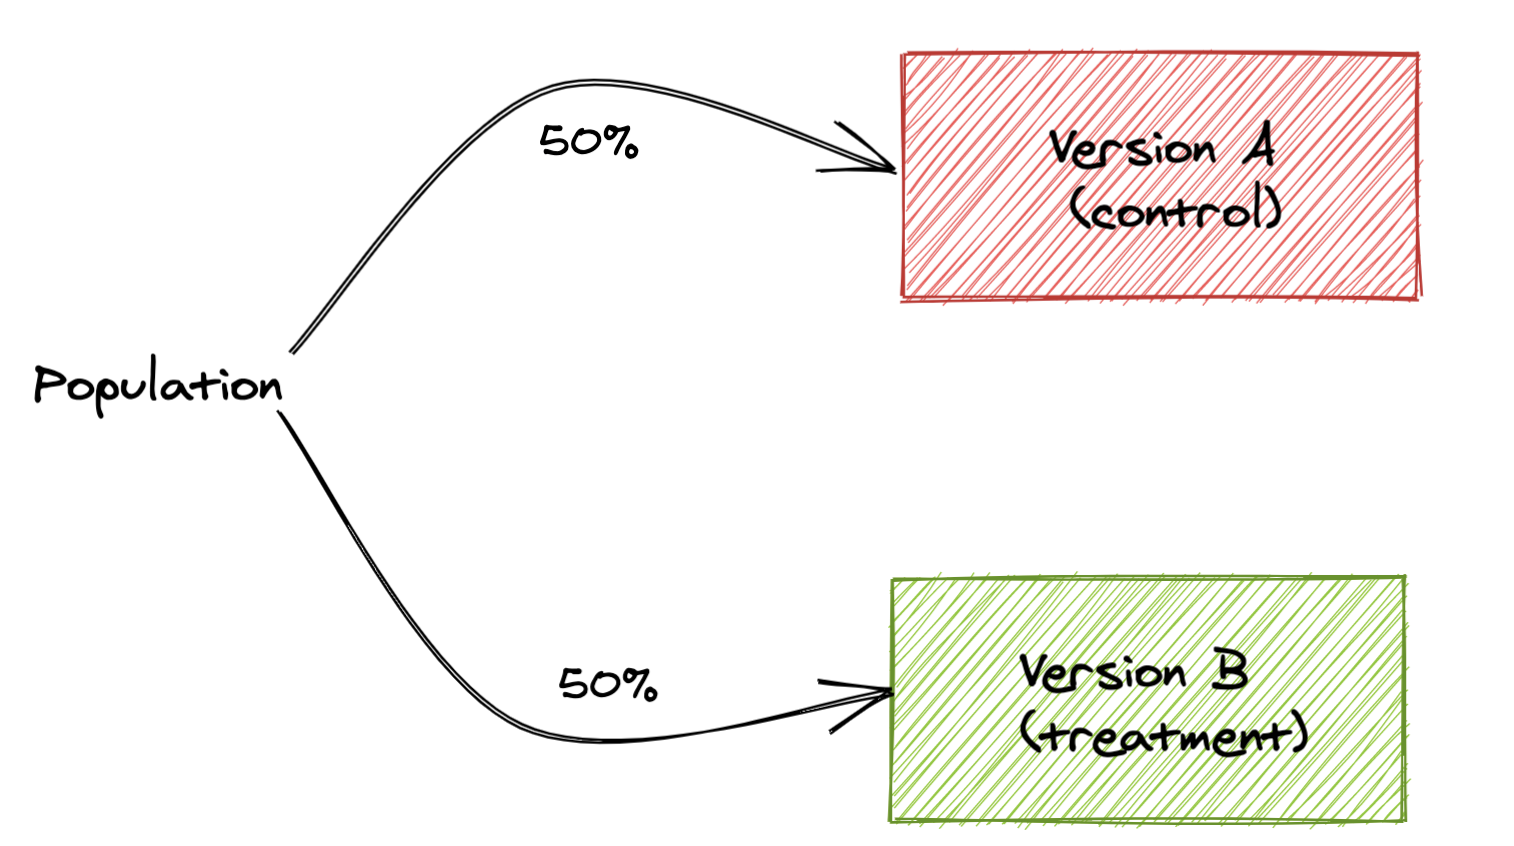
In the realm of web applications, three common ways of doing this are:
- Page views: for each page that is rendered (shown to a person), randomly choose to use version A or version B for that particular page.
- Sessions: sessions are just a grouping of page views made by the same person, typically bound by a specific time period. In session level randomization, we’ll randomly choose to use version A or version B of the site for all page views in a given session.
- Users: users are people, or a close approximation of them. If a user must log into your application, you can easily identify them with something like an account id. For most websites, you don’t need to log in, so users are instead identified using cookies. Because a single person could clear their cookies, or use a different device or browser, and therefore get assigned a new cookie, these will only serve as an approximation. In user level randomization, we can randomly choose whether to show version A or version B to a particular “user” across all their sessions and page views.
These are all examples of different randomization units. A randomization unit is the “who” or “what” that is randomly allocated to each group. Your choice of randomization unit will depend on multiple things.
- Technical feasibility will often be a limiting factor - do you have reliable ways of identifying sessions & users?
- The type of change you are making will also influence your choice. Are you testing out a new page layout and trying to see if it causes users to remain on a page for a longer period of time? Page view level randomization could be a good candidate in this case. What if you are testing out an entirely different color scheme for your site and seeing how it impacts your account signup rate? A different colour appearing on each page view could be a pretty jarring experience for users, so session or user level randomization would likely be a better choice in order to provide a consistent experience.
- The size of the effect you are trying to calculate and the available sample size may also influence your decision. Choosing a more narrow grain like page views can give you more statistical power since you’ll get a larger sample size when randomizing at this level, compared to sessions or users.
Another major factor in your decision will be the independence of your randomization units. I’m going to spend the rest of the post focusing on this point. I’ll do it in the context of choosing session versus user level randomization, but note that similar concepts would apply when choosing between session and page view level randomization.
Independence of randomization units
Sessions are a common choice as a randomization unit. In the context of an e-commerce site, they can be paired with readily available metrics like session conversion rate: the % of sessions with a purchase. In session level randomization, your experiment could look something like this:
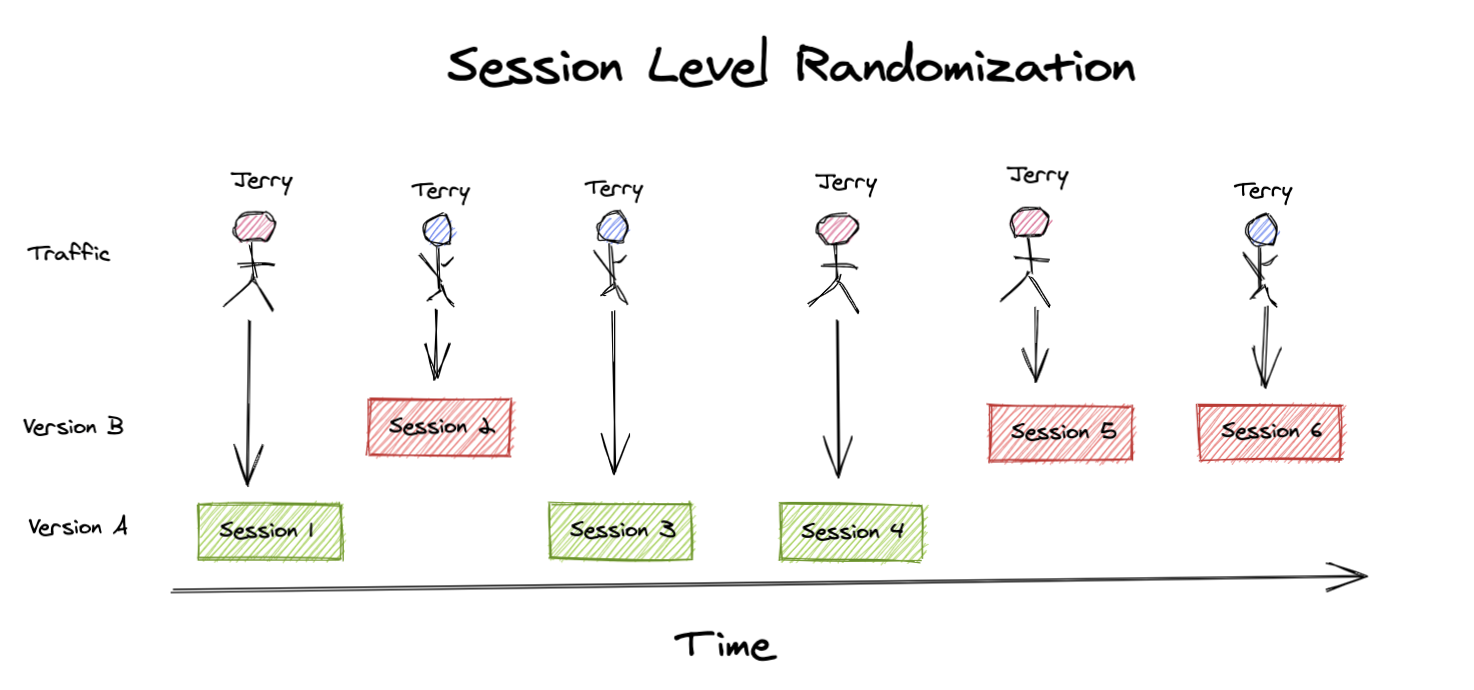
A user named Jerry visits the site. A session is initiated and randomly assigned to the control group - version A. For the duration of that session, Jerry will receive the version A experience. Another user named Terry visits the site, but they experience Version B for their session instead. Terry comes back another day, which creates a new session, but this time their session is assigned to the version A experience. This may all seem fine, but what if Terry’s decision to return was influenced by the version B experience from their last session?
In the world of online shopping, it’s not uncommon for a user to visit a site multiple times before choosing to make a purchase.

Of course, there’s also other people who may be more impulsive and buy something right away:
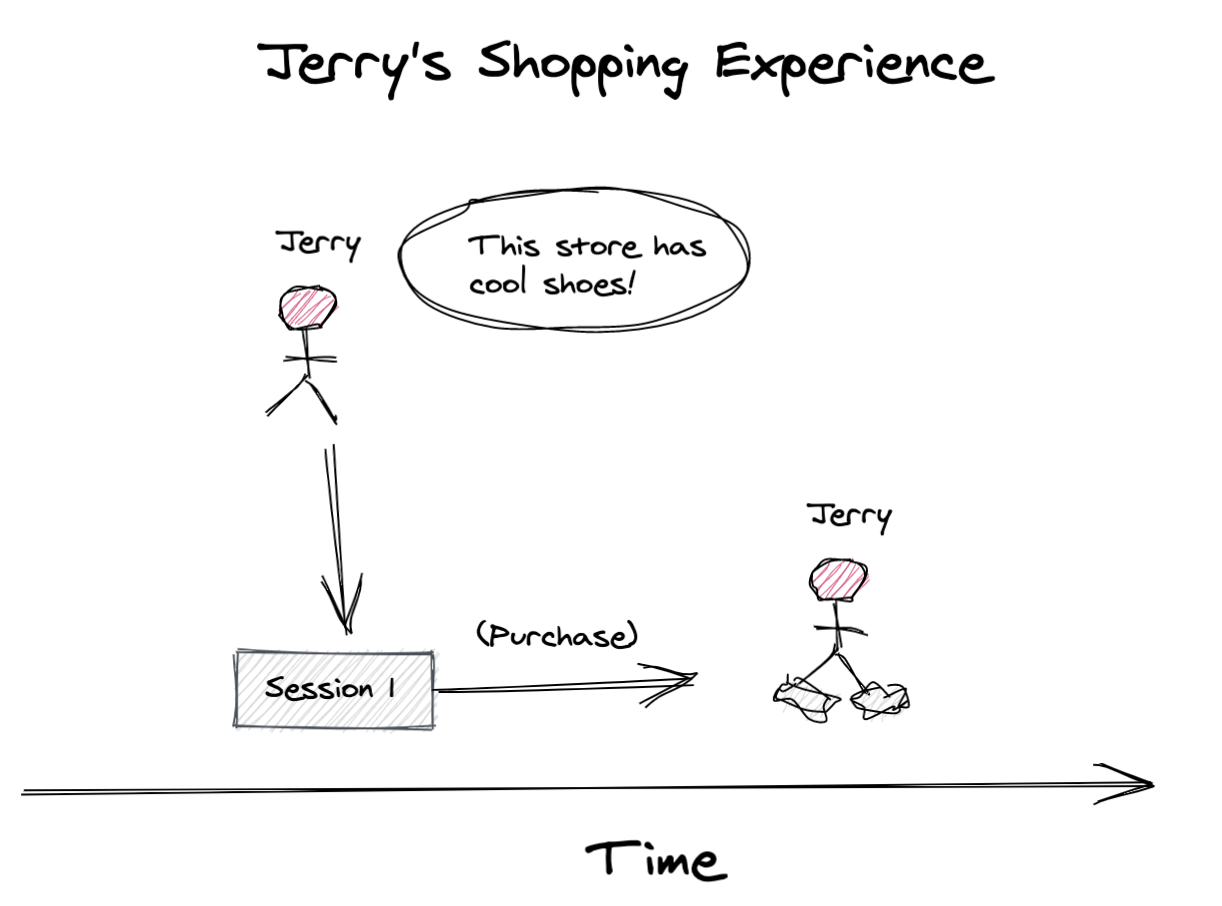
Session level randomization makes an assumption that each session is independent. This can be a big assumption because the things driving those sessions are people, and people have memory.
With the example of Terry’s shopping experience, it becomes clear that your experience in one session may also impact what happens in future sessions. Imagine we were A/B testing a new product recommendation algorithm. If the new algorithm gave a user in the treatment group a recommendation they really like, it’s likely that the odds they make a purchase will increase. But in the subsequent sessions when the user returns to make that purchase, they won’t necessarily fall in the treatment group again, which could lead to a misattribution of the positive effect.1
Session level randomization with independent sessions
Let’s build a little simulation to see what happens in these types of scenarios. I’ll assume we have 10,000 users and each user has on average, 2 sessions. We’ll assume a baseline session conversion rate of ~10%. For any session that falls in the treatment group, or version B experience, we’ll assume they get an uplift of ~2%, resulting in a ~12% conversion rate on average. A key assumption we’ll make for simplicity, but revisit later, is that the sessions per user and session conversion rate are independent - a user with 5 sessions has the same baseline session conversion rate as someone with just one.
To start, we’ll assume that sessions are truly independent - if Terry gets version B (treatment) in one session their probability of converting will be ~12%. If they come back for another session that is assigned to the original version A experience (control), the session conversion rate will be back to the baseline 10%. The experience from the first session has zero impact on the next session. You can head to the appendix to see the code I used to mock the experiment, and the corresponding Bayesian implementation of the A/B test. After simulating the same experiment hundreds of times, we see that:
- The A/B test correctly detects a positive effect 100.0% of the time (at a 95% “confidence” level)
- The A/B test detects an effect size of 203 bps (~2%) on average
When sessions are truly independent, everything works out as we’d expect.
Session level randomization with nonindependence
But, as I discussed above, it is very unlikely that sessions are completely independent.
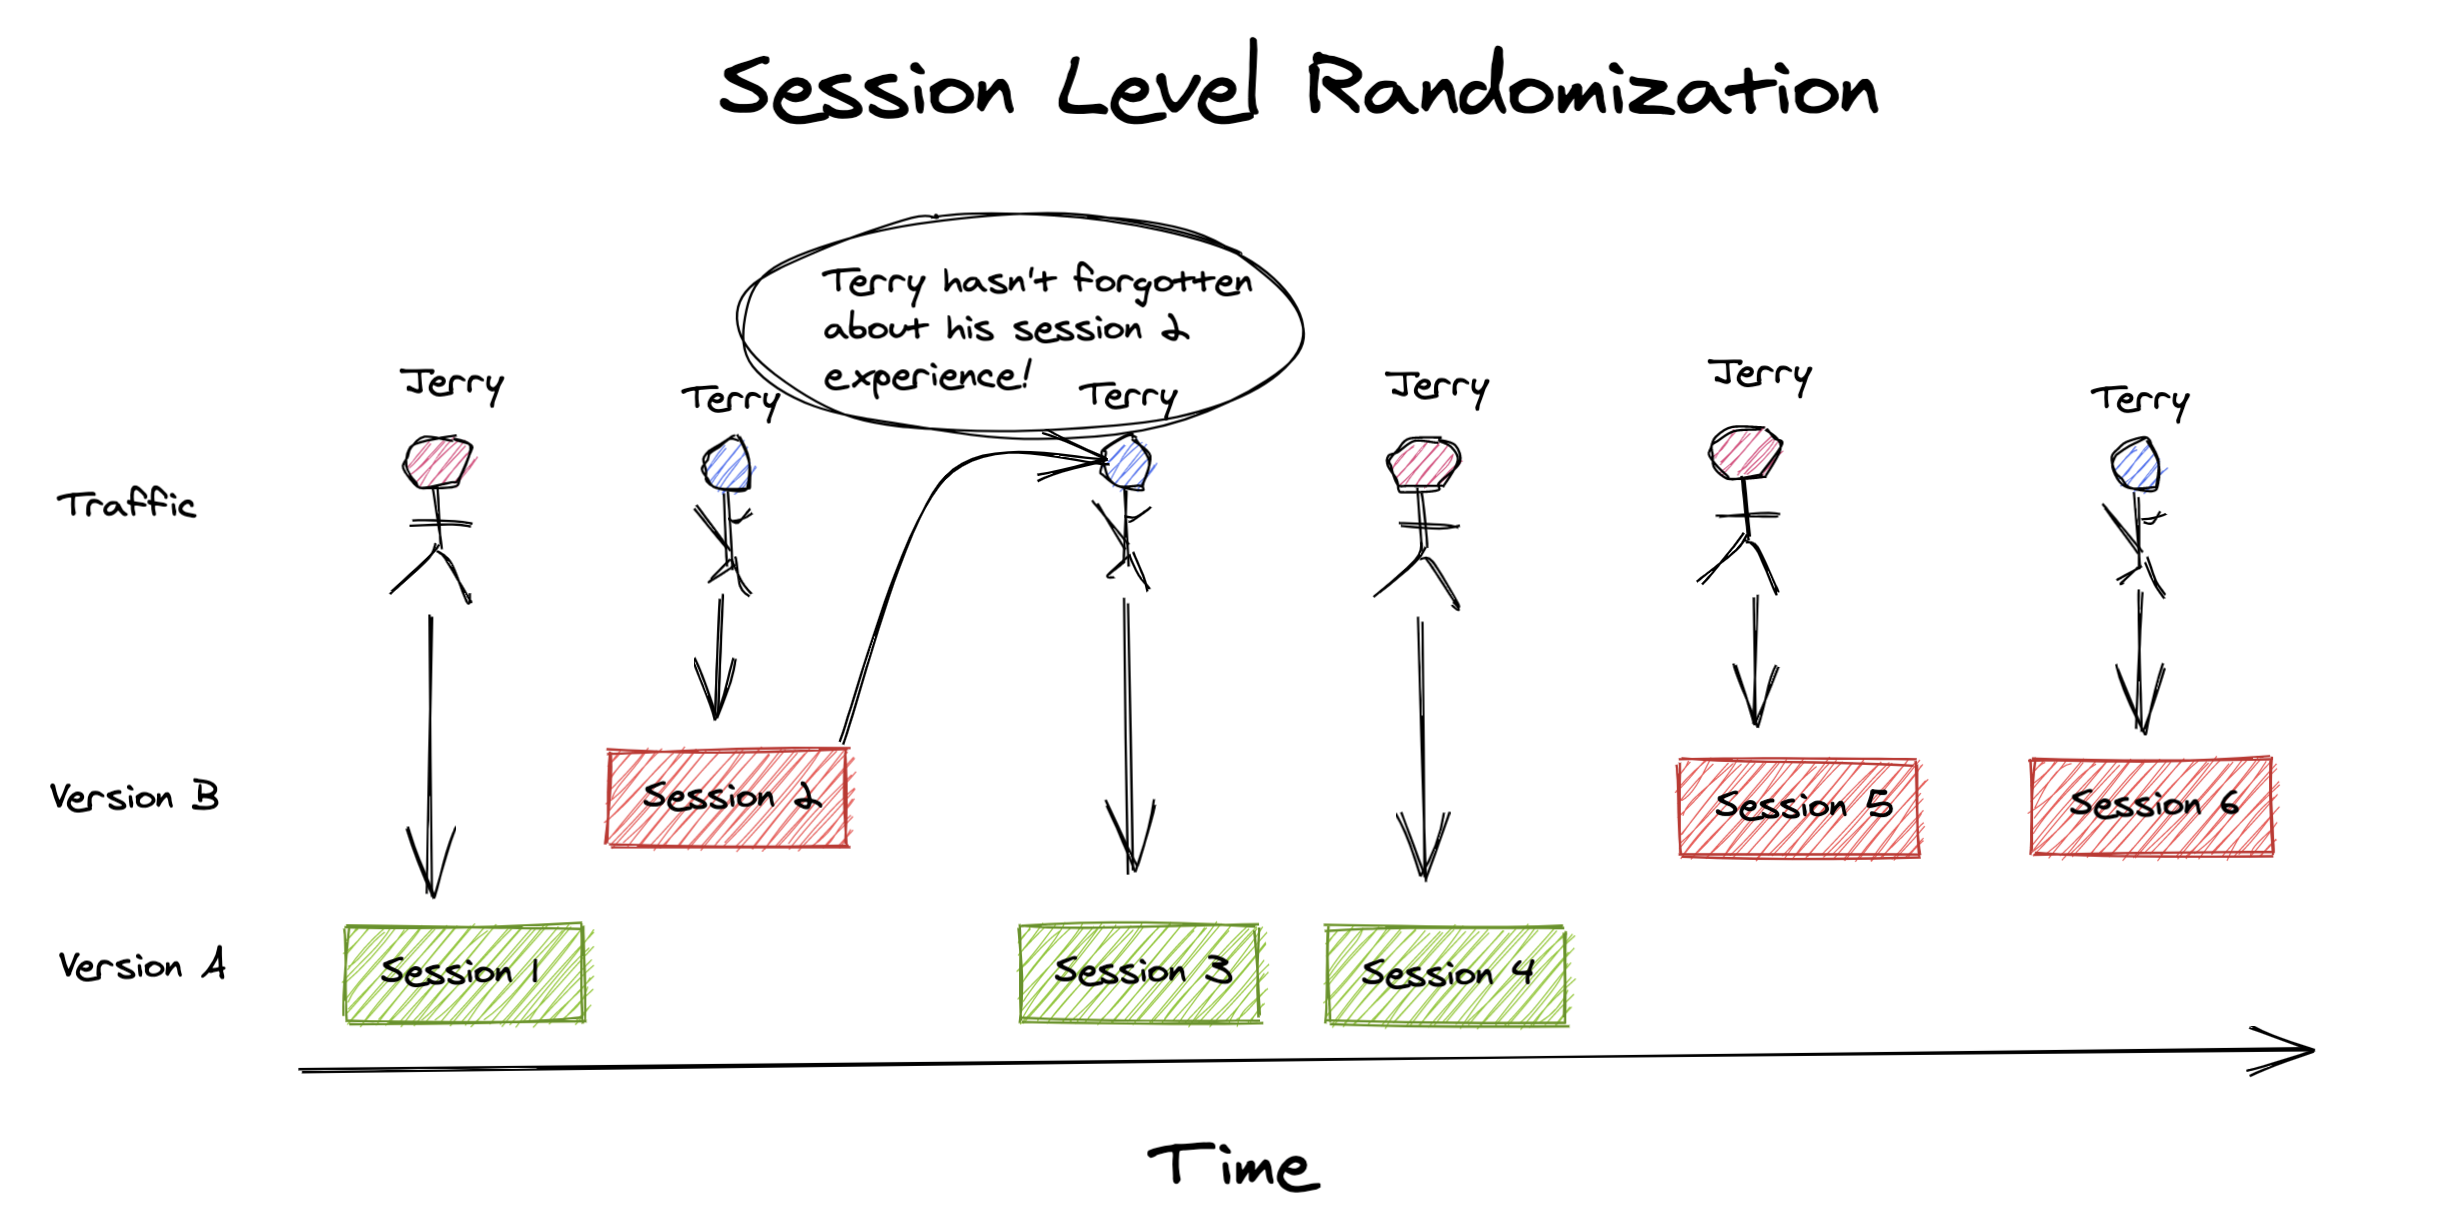
With the product recommendations experiment example I gave above in mind, let’s assume that once a user experiences a session in the treatment group, their session conversion rate is permanently increased. The first session assigned to the treatment and all subsequent sessions, regardless of assignment, convert at 12%. Again, head to the appendix to see how this is implemented. This time we see that:
- The A/B test correctly detects a positive effect 90.0% of the time (at a 95% “confidence” level)
- The A/B test detects an effect size of 137 bps (~1.4%) on average
With this “carryover effect”, we’re now under estimating the true effect, and detecting a positive impact less often. This may not seem too bad since we still correctly detected a positive effect. However, with smaller effect sizes, you will run into situations where this carryover effect, the user’s conversion permanently changing, causes you to miss detecting any effect entirely.
It’s important to note that I’ve looked at the most extreme case of this: 100% of the effect (the 2% increase) is carried over, forever. Of course, the reality is that is probably wears off to some degree. Or there is no carryover effect at all. Ultimately it’s for you to decide how much this could impact you, but hopefully I’ve done my job and spooked you.
User level randomization
Randomizing on the user instead of the session can help us deal with these non-independent sessions. In order to avoid the same pitfalls we faced with session level randomization, we must assume that the users themselves are independent, and do not influence one another’s decision to convert 2. Using our faithful shoppers Terry & Jerry, user level randomization would look something like this:
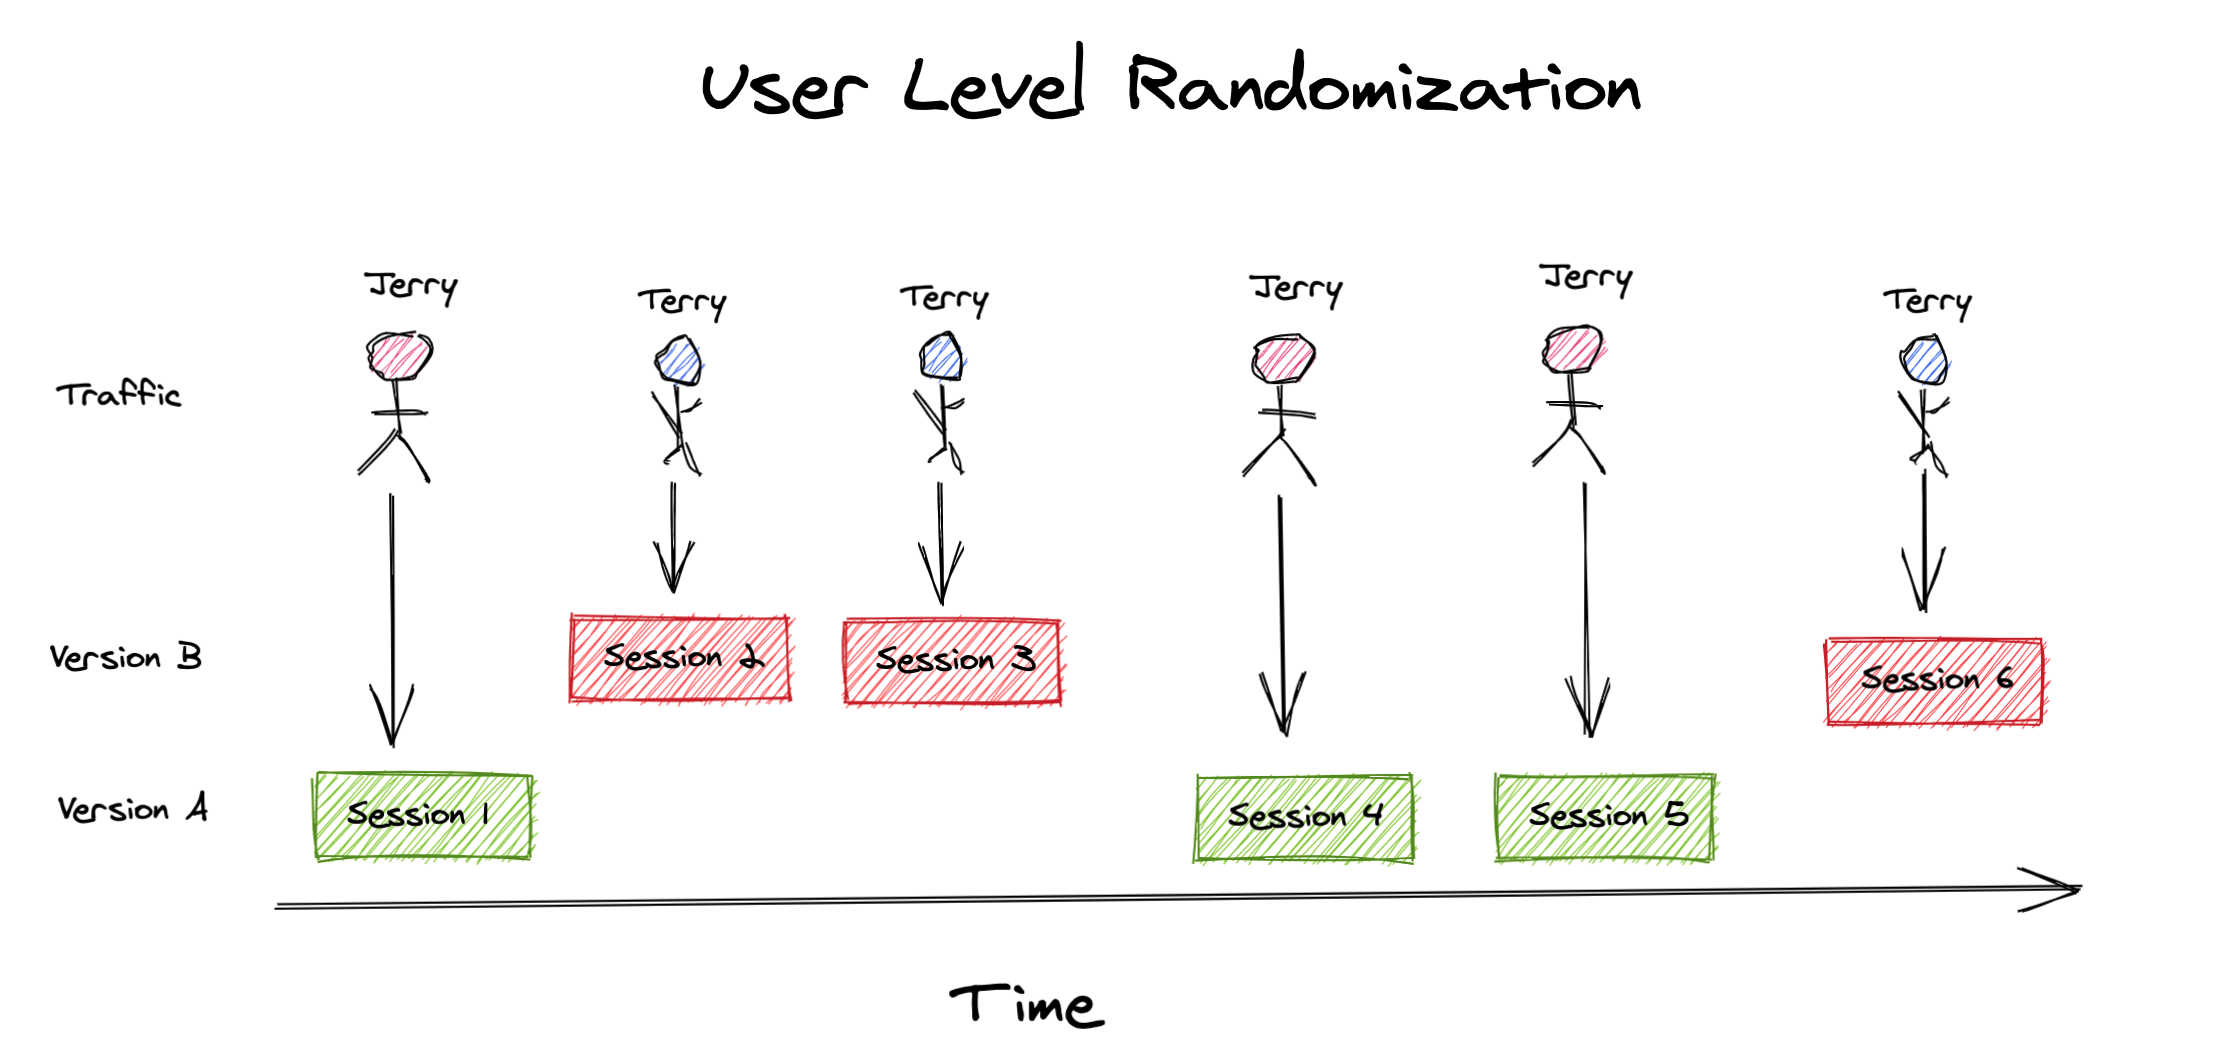
We can see that each user is consistently assigned to the same experience across all their sessions. After re-running our simulation with user level randomization, and the same “carryover effects” from before, we recover the results we originally expected:
- The A/B test correctly detects a positive effect 100.0% of the time (at a 95% “confidence” level)
- The A/B test detects an effect size of 199 bps (~2%) on average
Wrapping up…
If you think your sessions may not be independent and there could be some carryover effect, you should randomize at the user grain instead if possible. Failing to do so may result in an innacurate estimate of the true effect of some change, or failure to detect it altogether.
The extent to which this affects you will ultimately depend on the domain. You’ll have to use your judgement to decide how significant you think this carryover could be. The degree of impact will also depend on the distribution of sessions in your user base. If most users visit close to once, on average, then this will be much less of an issue.
Since user level randomization will generally involve using cookies to identify users, it is worth noting that this approach will not completely guarantee independence among your units. Cookies are an imperfect representation of humans, as a single person can appear under multiple “user cookies” if they ever switch browsers, devices, or clear their cookies. This shouldn’t dissuade you from user level randomization — it is still our best way to control for non-independence and give users a consistent experience, but rather make you aware that the approach does not provide a silver bullet to our problems. We live in an imperfect world.
Notes
1This is a violation of what is known as the stable unit treatment value assumption, or SUTVA. SUTVA is the assumption that a unit’s outcome does not depend on the treatment assignment of another unit (i.e. session) in the population.
2For most e-commerce sites, this is likely a pretty safe assumption. It’s hard to imagine a scenario where users in one group influence users in the other. One extreme example of where this could occur is if a company was A/B testing a price reduction in a popular product. Users in the treatment group could go to social media to discuss the price reduction they received, which could certainly have an effect on users in the control group who did not receive the discount. Interference or nonindependence of users is much more common in social networks, or any other applications where users frequently interact with each other.
⚠️ But is it okay to use session level metrics with user level randomization?
As discussed in many articles about online experiments (see here or here), it’s possible to see an increased rate of false positives when using session level metrics with user level randomization, which is what we were doing above ☝️. This can happen due to increased variance in session conversion rates depending on which users fall into each group in your experiment. When should you worry about this? I explore this topic more in a follow up post. The short answer is it depends on your data, and you should always run an offline A/A test to determine if you’d see an increased rate of false positives when your randomization unit <> analysis unit. If you are seeing higher than expected false positives, you’ll need to update your statistical test method accordingly or switch to a different analysis metric such that your randomization unit = analysis unit.
Appendix
All code used in this post can be found in this gist.
Simulating session level randomization with independent sessions
We’ll leverage numpy to randomly generate data for our 10,000 users. We will use:
- A geometric distribution to model the sessions per user
- A beta distribution to model both baseline conversion rates and the conversion uplift sessions will get from the treatment
For simplicity, we assume that these distributions are independent. For example, a user with a 3 sessions has the same session conversion rate (on average) as someone with just one.
num_users = 10000

sessions_per_user = np.random.geometric(0.5, size=num_users)

# each user has some baseline conversion rate, we'll say ~10%
baseline_conversion_rates = np.random.beta(100, 900, size=num_users);

# treatment group will get a +2% lift in conversion (20% relative increase)
conversion_uplifts = np.random.beta(20, 980, size=num_users);
A visualization of these three distributions is provided below.

With our simulated user data, we can now step through each of their sessions, randomly assign it to test or control, and then simulate whether or not it converted.
data = {
    'user': [],
    'session_id': [],
    'assignment': [],
    'session_converted': []
}

# Simulate all sessions for each user
for user_id, num_sessions in enumerate(sessions_per_user):
    for session_id in range(1, num_sessions+1):
        # randomly assign session to control (0) or test (1)
        assignment = np.random.randint(0, 2)

        # if assigned to test, give them a conversion boost
        new_conversion_rate = baseline_conversion_rates[user_id] + assignment*conversion_uplifts[user_id]

        # see if the session converted
        session_converted = np.random.choice([0, 1], p=[1-new_conversion_rate, new_conversion_rate])

        # record the results
        data['user'].append(user_id)
        data['session_id'].append(f"{user_id}-{session_id}")
        data['assignment'].append(assignment)
        data['session_converted'].append(session_converted)

# store in a dataframe for easier analysis downstream
df = pd.DataFrame(data)
Bayesian A/B test of two proportions
Now that we have our sessions data, we can perform our statistical comparisons of the two groups. I’m using some Bayesian methods since I find them much more intuitive, but you could achieve a similar output with a Frequentist approach. If you’re unfamiliar with Bayesian methods, I highly recommend Cam Davidson-Pilon’s book Bayesian Methods for Hackers for a quick intro, and Statistical Rethinking by Richard McElreath for deeper study of the subject.
# calculate the total number of sessions and conversions in each group
control_converted = df[df.assignment==0].session_converted.sum()
control_total = df[df.assignment==0].session_converted.count()
test_converted = df[df.assignment==1].session_converted.sum()
test_total = df[df.assignment==1].session_converted.count()

# We'll model the posterior distribution of the session conversion rates
# using a beta distribution and a naive uniform prior i.e. beta(1, 1).
# We then draw 50,000 samples from each of the posterior distributions
num_samples = 50000
control_samples = np.random.beta(
        1 + control_converted,
        1 + control_total - control_converted,
        size=num_samples
)
test_samples = np.random.beta(
    1 + test_converted,
    1 + test_total - test_converted,
    size=num_samples
)
The Bayesian approach to comparing conversion rates gives you samples from the posterior distributions. You can then do simple checks, like see how often sample conversion rates from our test group are higher than those from the control:
>>> test_gt_control = (test_samples > control_samples).mean()
>>> print(f"Test converts higher than control: {test_gt_control:0.0%} of the time")
Test converts higher than control: 99.58% of the time
Using this methodology, you can conclude that test is better than control if it converts higher more than 95% of the time. Of course, you can lower this threshold if you want to be less conservative. You can also visualize the posterior distributions and use them to estimate the true difference in conversion rates.

Repeating our experiment many times
To get more consistent results, we’ll want to simulate the mock experiment from above multiple times. To do this, I’ll leverage dask, which makes it dead simple to parallelize things. To use dask, we’ll need to wrap our code into a function, and have it spit out some relevant statistics:
def run_simulation(...):
    """
    Simulate an A/B experiment
    """

    # code from above
    ...

    return {
        'test_gt_control': (test_samples > control_samples).mean(),
        'mean_diff': (test_samples - control_samples).mean(),
        'diff_80_pct_credible_interval': [
            np.percentile(test_samples - control_samples, 10),
            np.percentile(test_samples - control_samples, 90),
        ]
    }
Next, you can spin up a local dask cluster. Here, I specify the number of workers and threads I want since I know this is a compute bound process and won’t benefit from multi-threading.
cluster = LocalCluster(
    n_workers=12, # my mac has 12 cores, set this to however many you have
    threads_per_worker=1,
    processes=True,
    silence_logs=logging.ERROR
)
client = Client(cluster)
client
Once you’ve created this client in your notebook, any dask computations you trigger will automatically get executed in this cluster. The code below shows how you can tell your cluster to run your experiment 250 times. Dask will take care of dividing up the work among your workers.
delayed_results = []

NUM_EXPERIMENTS = 250
for iteration in range(0, NUM_EXPERIMENTS):
    result = dask.delayed(run_simulation)(...)
    delayed_results.append(result)

# up until now, we've just built up our task graph (lazy evaluation)
# we can now trigger the execution
results = dask.compute(*delayed_results)

num_positive_effects_detected = np.sum([res['test_gt_control'] > 0.95 for res in results])
avg_effect_size = np.mean([res['mean_diff'] for res in results if res['test_gt_control'] > 0.95])

print(
    f"Detected positive effect {num_positive_effects_detected/len(results):0.1%} of the time\n"
    f"Average effect size detected: {avg_effect_size*100*100:0.0f} bps\n"
)
Another benefit of Dask is that it comes with some nice dashboards that integrate directly with Jupyter Lab and let you monitor the progress of your simulations:

Adjusting for nonindependence
To adjust for nonindependence of sessions, we’ll modify our code from before so that we can permanently change a user’s session conversion rate once they have been exposed to the treatment.
# create a copy of the session conversion rates for each user
# we'll use this to keep track of each user's session conversion rate
# throughout the simulation in case it changes
conversion_rates = baseline_conversion_rates.copy()

# Simulate all sessions for each user
for user_id, num_sessions in enumerate(sessions_per_user):
    for session_id in range(1, num_sessions+1):
        # randomly assign session to control (0) or test (1)
        assignment = np.random.randint(0, 2)

        if assignment == 1:
            # increase user's conversion rate permanently
            conversion_rates[user_id] = baseline_conversion_rates[user_id] + conversion_uplifts[user_id]
            new_conversion_rate = conversion_rates[user_id]
        else:
            new_conversion_rate = conversion_rates[user_id]

        # see if the session converted
        session_converted = np.random.choice([0, 1], p=[1-new_conversion_rate, new_conversion_rate])

        # remaining code is the same as before
        ...
User level randomization
Implementing user level randomization is fairly straightforward. We can just adjust our for loop to have the assignment happen once per user, rather than for each session:
for user_id, num_sessions in enumerate(sessions_per_user):

    # Assignment now happens here, instead of below
    # randomly assign session to control (0) or test (1)
    assignment = np.random.randint(0, 2)

    for session_id in range(1, num_sessions+1):
        # no more assignment here
        ...