
Serving machine learning models with AWS Lambda
A brief discussion about model serving with AWS Lambda and the cold start performance of different setups.
Historical challenges
The benefits of serverless offerings from cloud providers are well known at this point. They eliminate the hassle of provisioning & managing servers, automatically take care of scaling in response to varying workloads, and can be much cheaper for lower volume services since they don’t run 24/7. Despite these benefits, serverless options like AWS Lambda have rarely been used for serving machine learning (ML) models due to a few major drawbacks:
- Deployment package management. For any libraries with C dependencies (numpy, scipy, pandas, sklearn, tensorflow, etc..), you must make sure your Lambda deployment package is using versions of these libraries that were compiled on Amazon Linux. Since most ML libraries will have some C dependencies, this hurdle will almost always be present. Getting around this usually means having a separate docker image or EC2 instance whose job is solely to generate your deployment package with the correctly compiled libraries.
- Deployment package size limits. Even with the right Python library versions in place, your total deployment package size has to be less than 250MB. For large libraries like tensorflow/pandas/numpy/scipy, this limit is easily exceeded. In order to get around this limit, users could split up their deployment packages into multiple layers, and individually deploy each of those1. For users of the Zappa framework, they could take advantage of the
slim_handlerfeature, which loads the dependencies from S3 when the Lambda function is instantiated. Neither of these options are great. - RAM limits: Historically, the Lambda function itself could not use more than 3GB of RAM. This became an issue for serving larger ML models that require more RAM.
- Cold starts. If a serverless function has not been executed for ~15 minutes2, the next request will experience what is known as a cold start since the function’s container must be provisioned. Cold starts will also occur when Lambda is autoscaling in response to higher request volumes, as more functions are spun up and must be instantiated. Cold starts can take >5 seconds, and extend even longer if you have expensive imports or initializations. When using Lambda to serve an ML model, you’ll typically instantiate your model object once during the cold start, so it can be re-used on all subsequent “warm” requests. This can easily add another few seconds to the cold start time as you load the model from disk or a storage service like S3.
Sounds like a mess worth avoiding…
Container image support to the rescue?
With the December 2020 announcement of container image support and a new 10GB RAM limit, I got a renewed sense of hope for AWS lambda to be a more viable option for serving ML models. With this release, you can now have your Lambda function run within a Docker image of your choosing. All the libraries you need can be installed directly in your image, as long as your total image size remains below 10GB. No more worrying about incorrectly compiled or large Python libraries. Need to serve a 2GB TensorFlow model? Go for it.
The only question remaining was whether cold starts would still be an issue in this setup. Perhaps having a model that is baked into the docker image and loaded from disk, rather than S3, could mitigate this? Let’s find out…
Benchmarking cold starts
Model creation
In order to do some performance benchmarking, I first trained a simple GBM to predict whether income would exceed $50K/yr based on some census data3.
import pickle
import pandas as pd
from sklearn.ensemble import GradientBoostingClassifier

df = pd.read_csv('data.csv')

features = [
    'age',
    'fnlwgt',
    'education_num',
    'capital_gain',
    'capital_loss',
    'hours_per_week'
]

X = df[features]
y = df.target
X_train, X_test, y_train, y_test = train_test_split(X, y, test_size=0.33, random_state=42)

# intentionally overfit the model by increasing n_estimators and max_depth
# this results in a larger model file size, which we want to test
clf = GradientBoostingClassifier(
    n_estimators=2000,
    learning_rate=1.0,
    max_depth=20,
    random_state=0
)
clf = clf.fit(X_train, y_train)

with open('model.pkl', "wb") as f_out:
    pickle.dump(clf, f_out)
By fiddling with the n_estimators and max_depth hyperparameters, I created three different models that were 140MB, 420MB and 1090MB on disk.
Model deployment
I used Flask along with Zappa, which recently added support for Docker deployments, to serve and deploy my ML API endpoint, but you could easily use a different set of frameworks. The app contains a single /predict endpoint which returns the prediction and corresponding probability:
import os

from flask import Flask, jsonify, request

from .common import load_from_s3, load_from_disk

app = Flask(__name__)

MODEL_SOURCE = os.environ.get('MODEL_SOURCE')
if MODEL_SOURCE  == 'S3':
    MODEL = load_from_s3()
elif MODEL_SOURCE == 'DISK':
    MODEL = load_from_disk()
else:
    raise ValueError(f"Invalid value for MODEL_SOURCE: {MODEL_SOURCE}")

features = [
    'age',
    'fnlwgt',
    'education_num',
    'capital_gain',
    'capital_loss',
    'hours_per_week'
]

@app.route("/")
def serve():
    return jsonify(success=True)

@app.route("/predict", methods=["POST"])
def predict():
    request_payload = request.json
    payload = [request_payload[feature] for feature in features]
    proba = MODEL.predict_proba([payload])[0][1]
    return {
        'prediction': '>$50K' if proba >= 0.5 else '<=$50K',
        'probability': proba
    }
As you can see, the model will get loaded from disk or S3 depending on how we set the MODEL_SOURCE environment variable. We’ll test out two different configurations:
- Docker image with the pickled model file baked into the image and consequently loaded from disk on startup
- A slimmer Docker image with the pickled model file loaded from S3 on startup
Locust for load testing
In order to come up with some performance benchmarks, I used locust, an open source load testing tool written in Python. My locustfile.py setup looked like this:
import logging
import time

from locust import HttpUser, task, between

class BasicUser(HttpUser):
    wait_time = between(3, 5)
    payload = {
            "age": 34,
            "fnlwgt": 261799,
            "education_num": 11,
            "capital_gain": 0,
            "capital_loss": 0,
            "hours_per_week": 56
    }

    @task
    def ml_request(self):
        start = time.time()
        response = self.client.post("/predict", json=self.payload)
        end = time.time()
        logging.info(f"{1000*(end-start):0.2f}")
This defines a “user” who will make a request to our ML prediction endpoint every 3-5 seconds with the same payload. Using the locust CLI, I then ran the following command to trigger a headless locust test:
export PREFIX=DOCKER_DISK_v1 && locust -f locustfile.py --host <your_deployed_app_url> --users 100 --spawn-rate 20 --run-time 60s --csv "locust_logs/${PREFIX}" --csv-full-history --html "locust_logs/${PREFIX}_locust_report.html" --logfile "locust_logs/${PREFIX}_locust_logs.txt" --headless
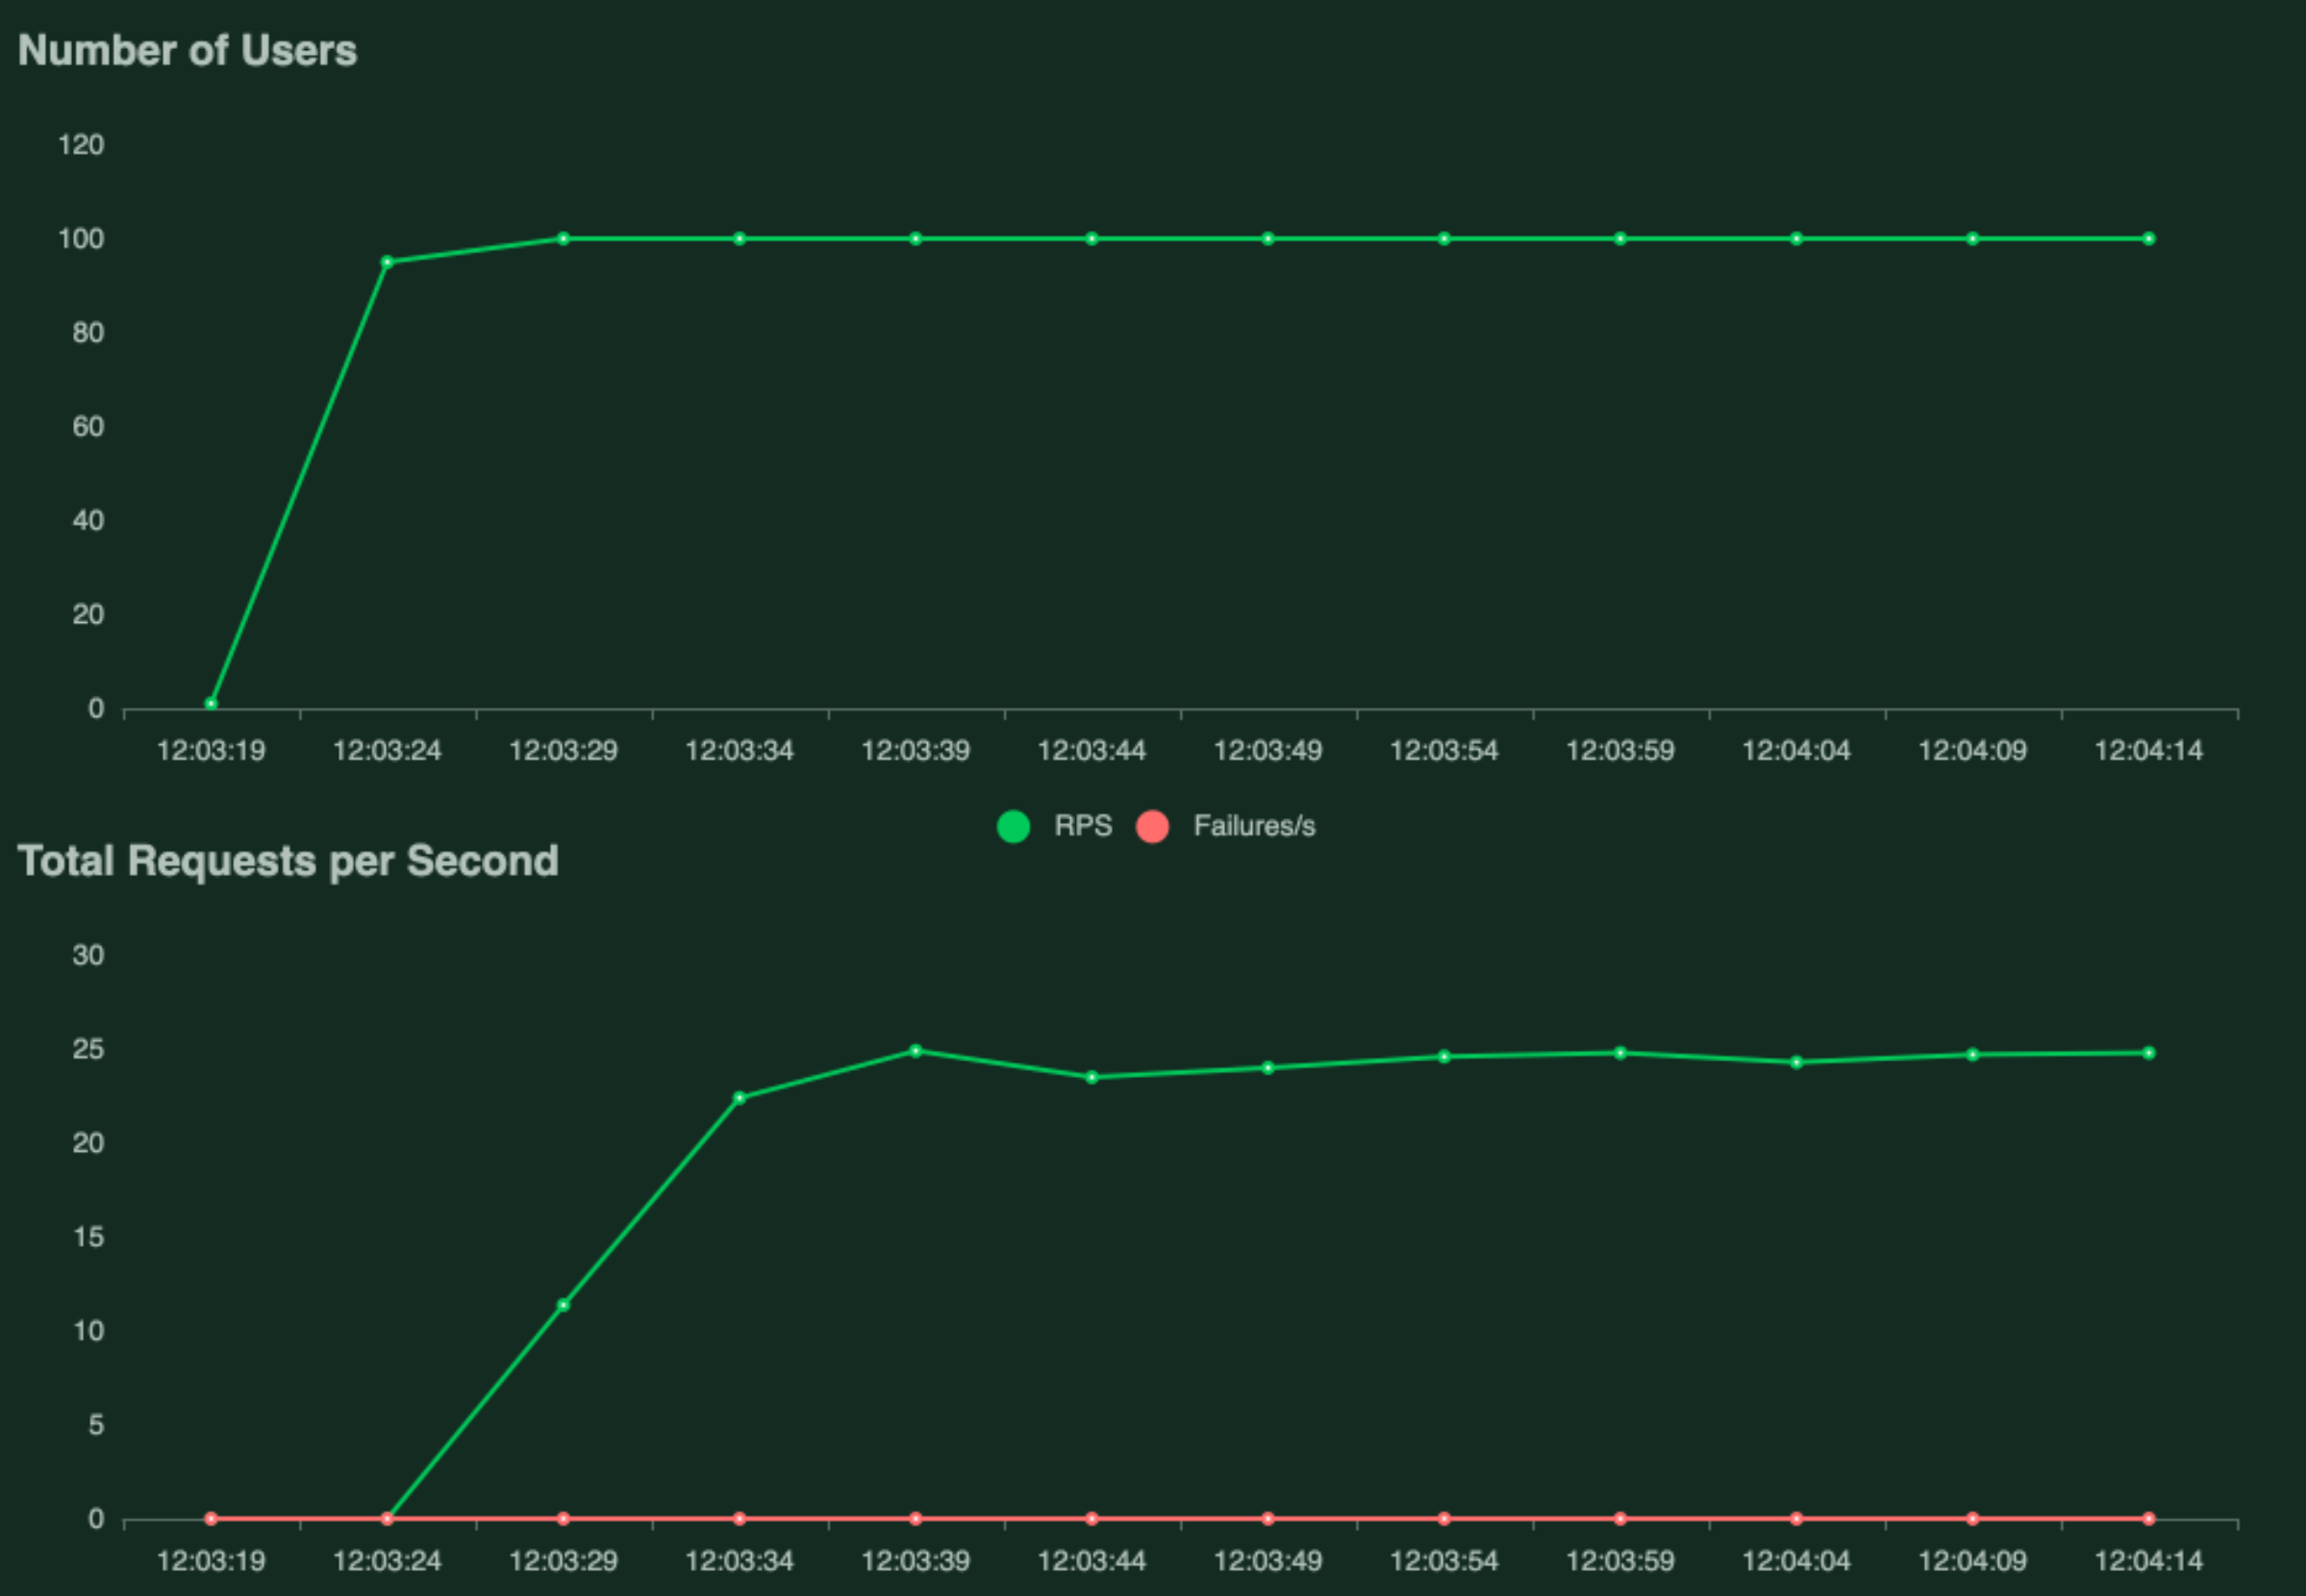
This command will spawn 100 users in 5 seconds (spawn rate of 20 users/second) and let those users execute requests for 60 seconds. From the locust generated plots below, you can see that this results in ~25 requests per second.
This command will output a bunch of files, including a log file DOCKER_DISK_v1_locust_logs.txt that looks like this:
[2021-07-24 15:37:19,239] Ians-MBP.local/INFO/locust.main: Run time limit set to 60 seconds
[2021-07-24 15:37:19,240] Ians-MBP.local/INFO/locust.main: Starting Locust 1.6.0
[2021-07-24 15:37:19,240] Ians-MBP.local/INFO/locust.runners: Spawning 100 users at the rate 20 users/s (0 users already running)...
[2021-07-24 15:37:24,568] Ians-MBP.local/INFO/locust.runners: All users spawned: BasicUser: 100 (100 total running)
[2021-07-24 15:37:25,745] Ians-MBP.local/INFO/root: 3799.82
[2021-07-24 15:37:26,095] Ians-MBP.local/INFO/root: 4666.09
[2021-07-24 15:37:27,399] Ians-MBP.local/INFO/root: 7841.94
[2021-07-24 15:37:27,502] Ians-MBP.local/INFO/root: 7734.79
[2021-07-24 15:37:27,798] Ians-MBP.local/INFO/root: 8453.01
...
...
[2021-07-24 15:38:18,632] Ians-MBP.local/INFO/root: 62.76
[2021-07-24 15:38:18,649] Ians-MBP.local/INFO/root: 67.33
[2021-07-24 15:38:18,661] Ians-MBP.local/INFO/root: 92.54
[2021-07-24 15:38:18,667] Ians-MBP.local/INFO/locust.main: Time limit reached. Stopping Locust.
[2021-07-24 15:38:18,667] Ians-MBP.local/INFO/locust.runners: Stopping 100 users
[2021-07-24 15:38:18,682] Ians-MBP.local/INFO/locust.runners: 100 Users have been stopped, 0 still running
[2021-07-24 15:38:18,730] Ians-MBP.local/INFO/locust.main: Running teardowns...
[2021-07-24 15:38:18,731] Ians-MBP.local/INFO/locust.main: Shutting down (exit code 0), bye.
[2021-07-24 15:38:18,731] Ians-MBP.local/INFO/locust.main: Cleaning up runner...
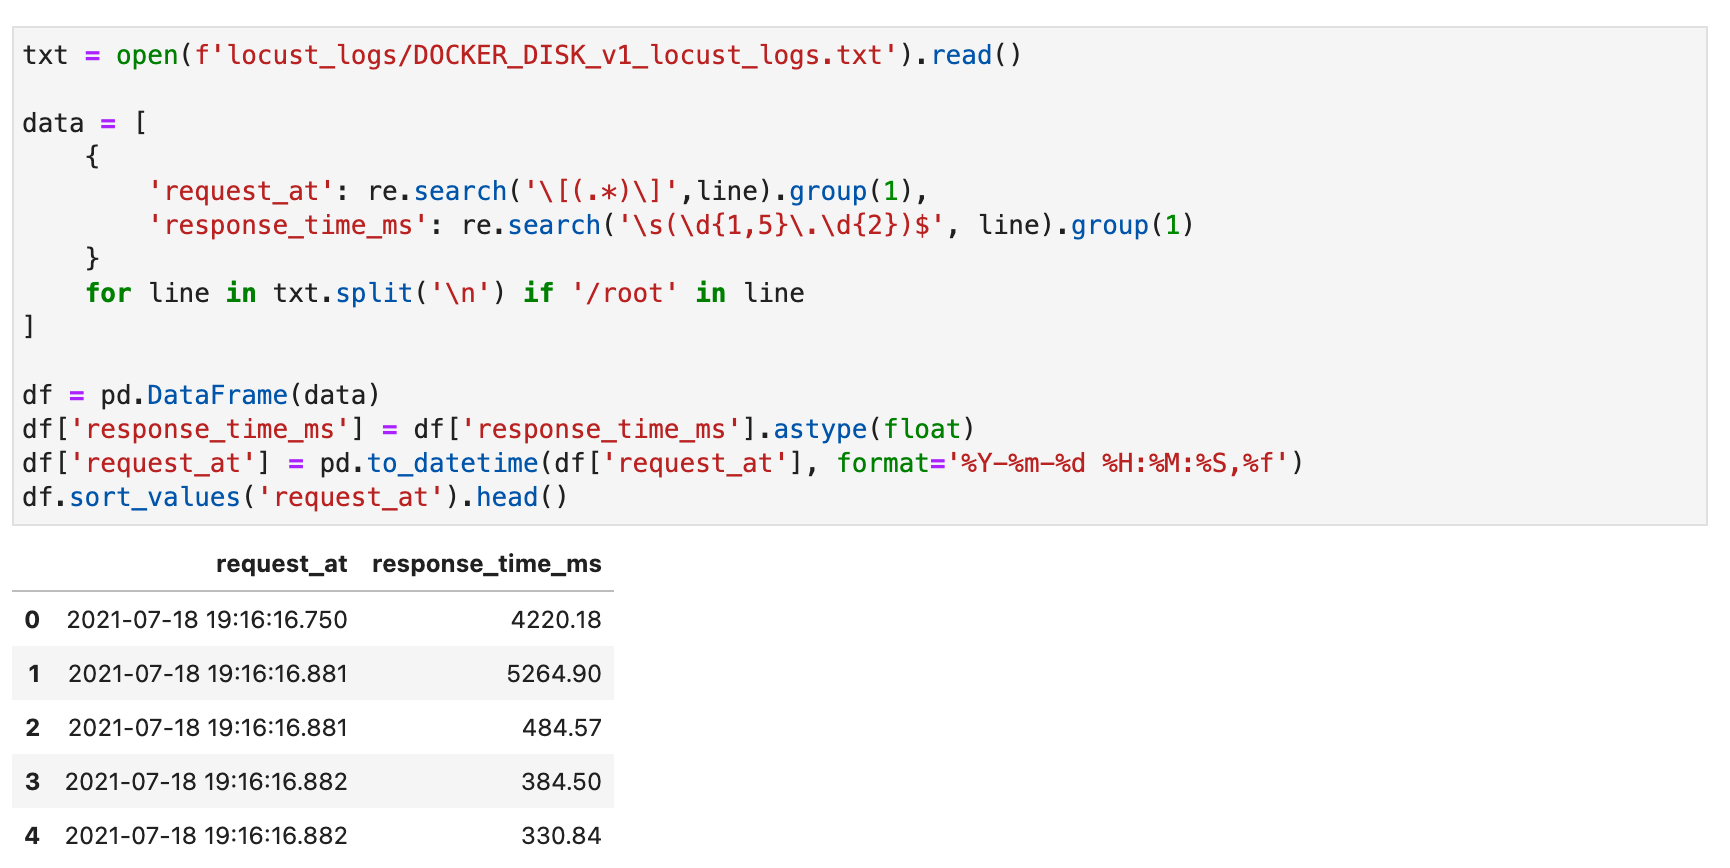
This can then be easily consumed and parsed in Python to get the distribution of performance 4.
Load test results
Typical performance profile
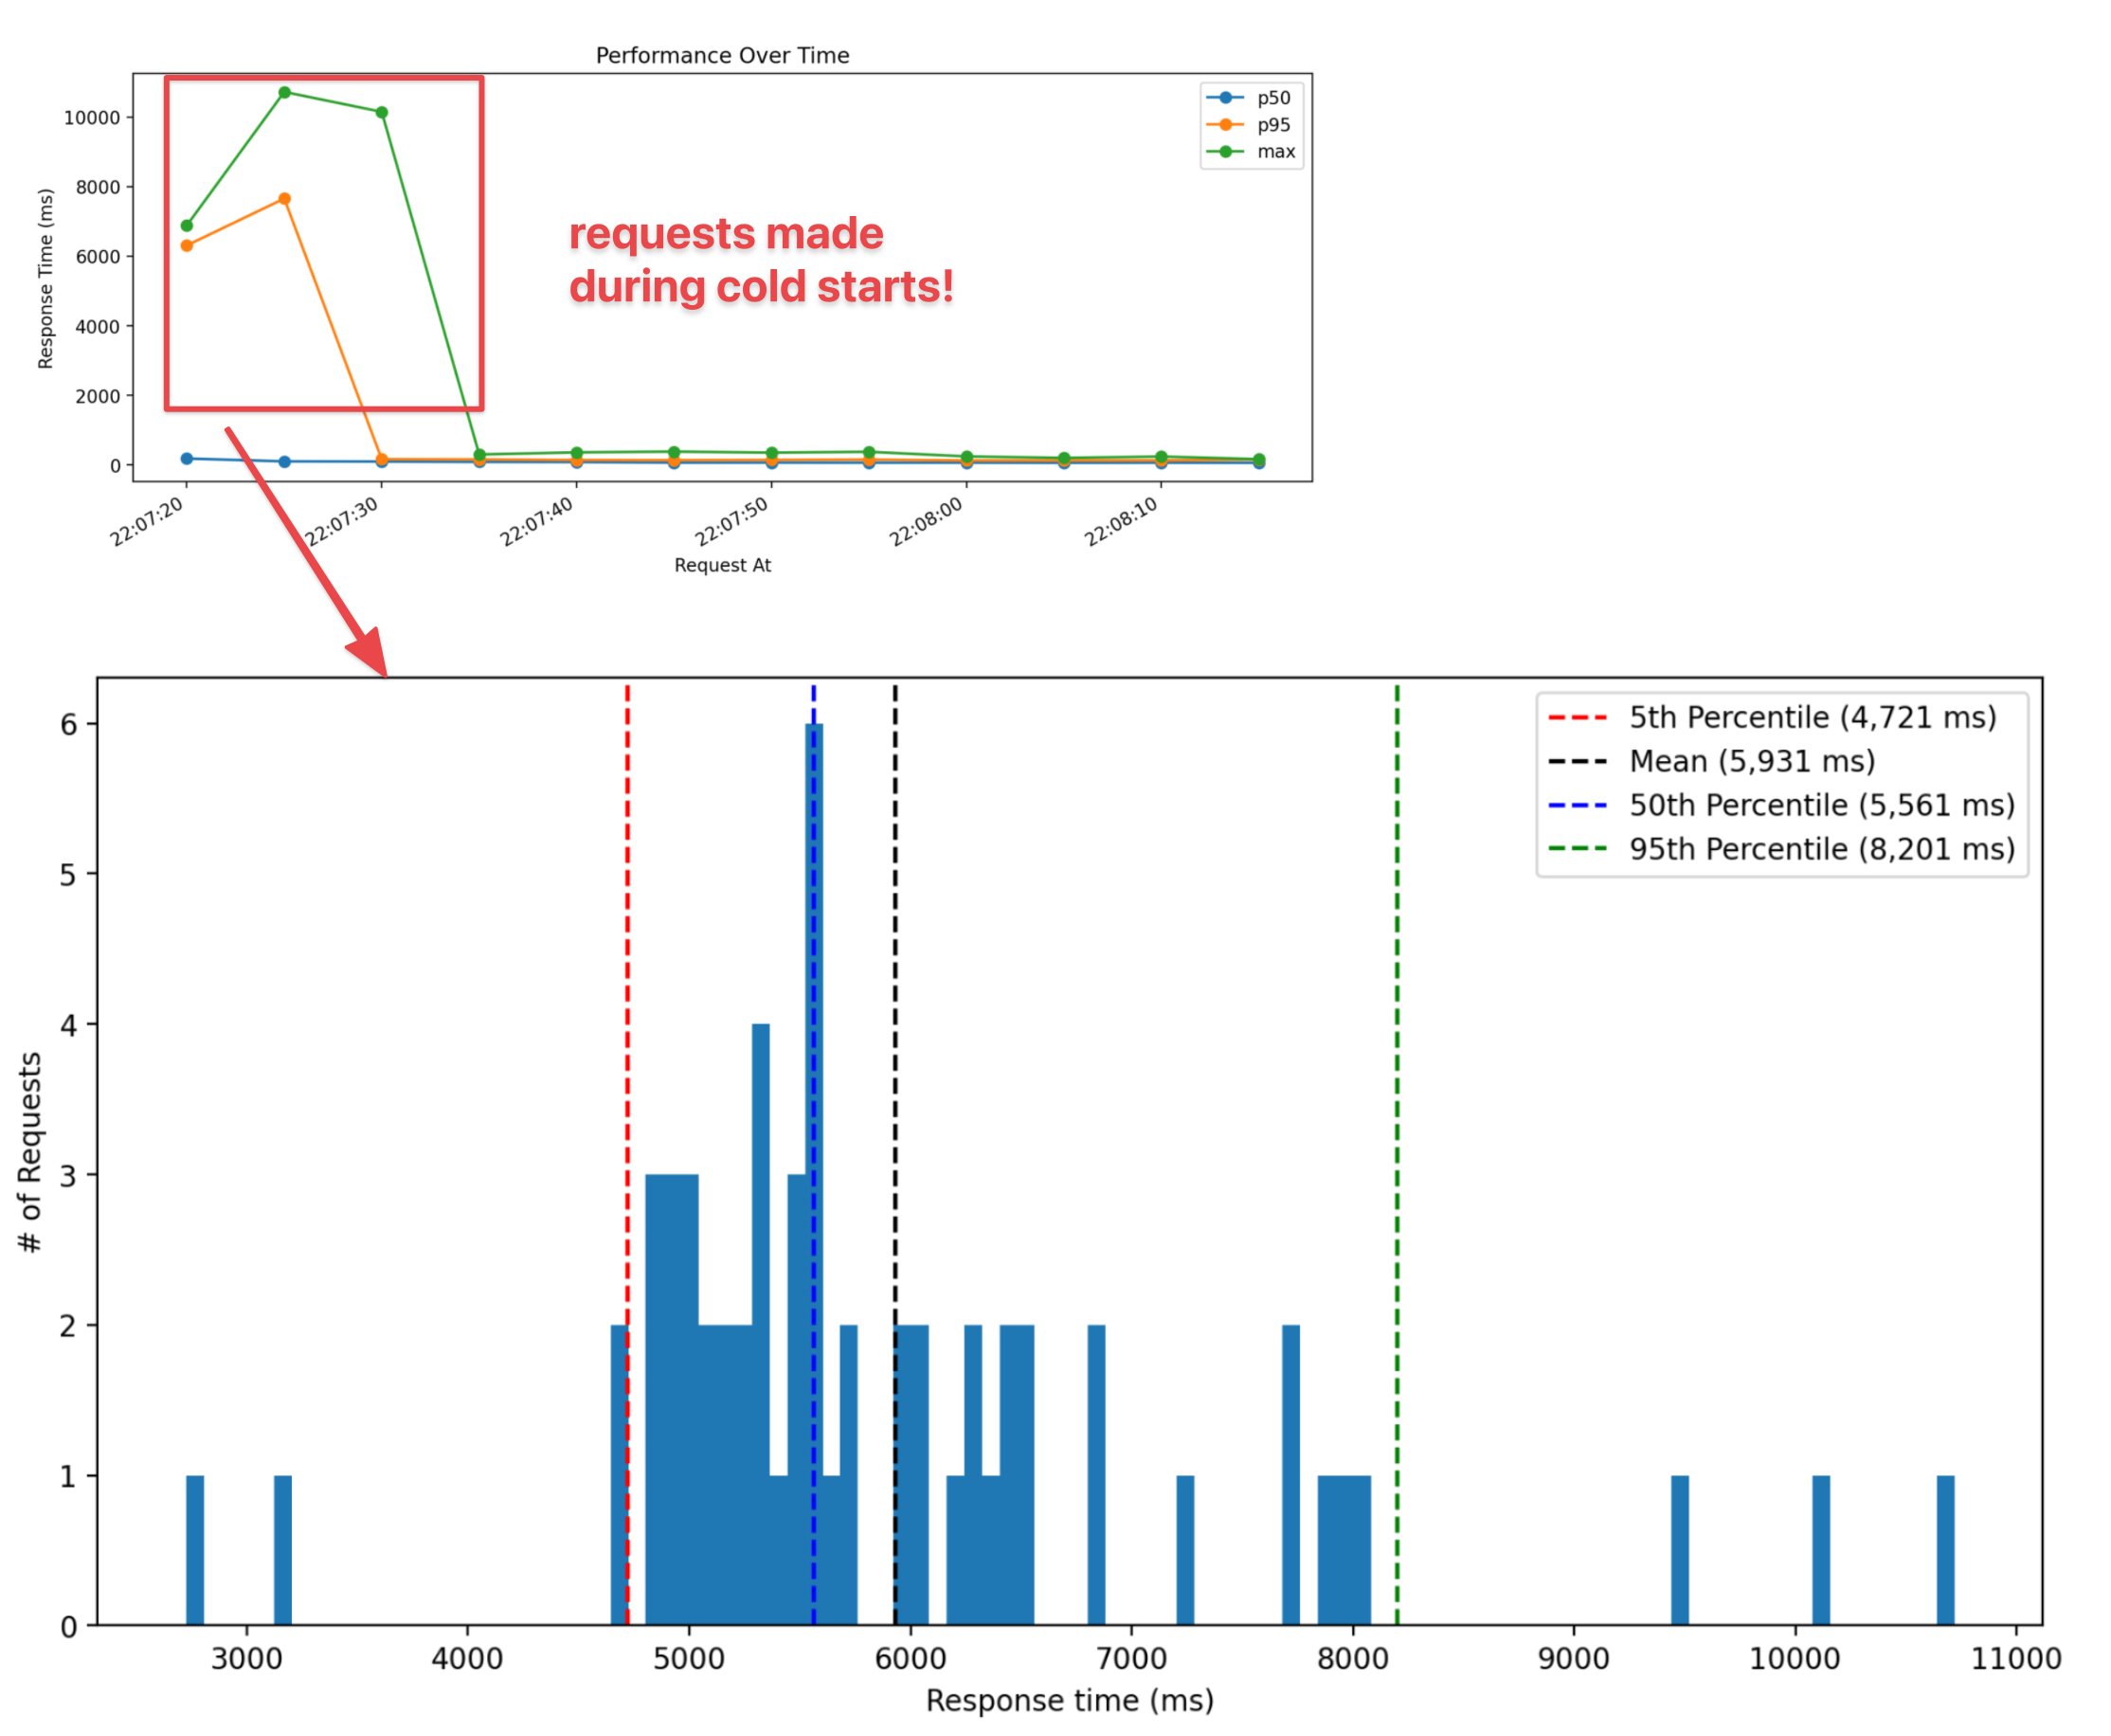
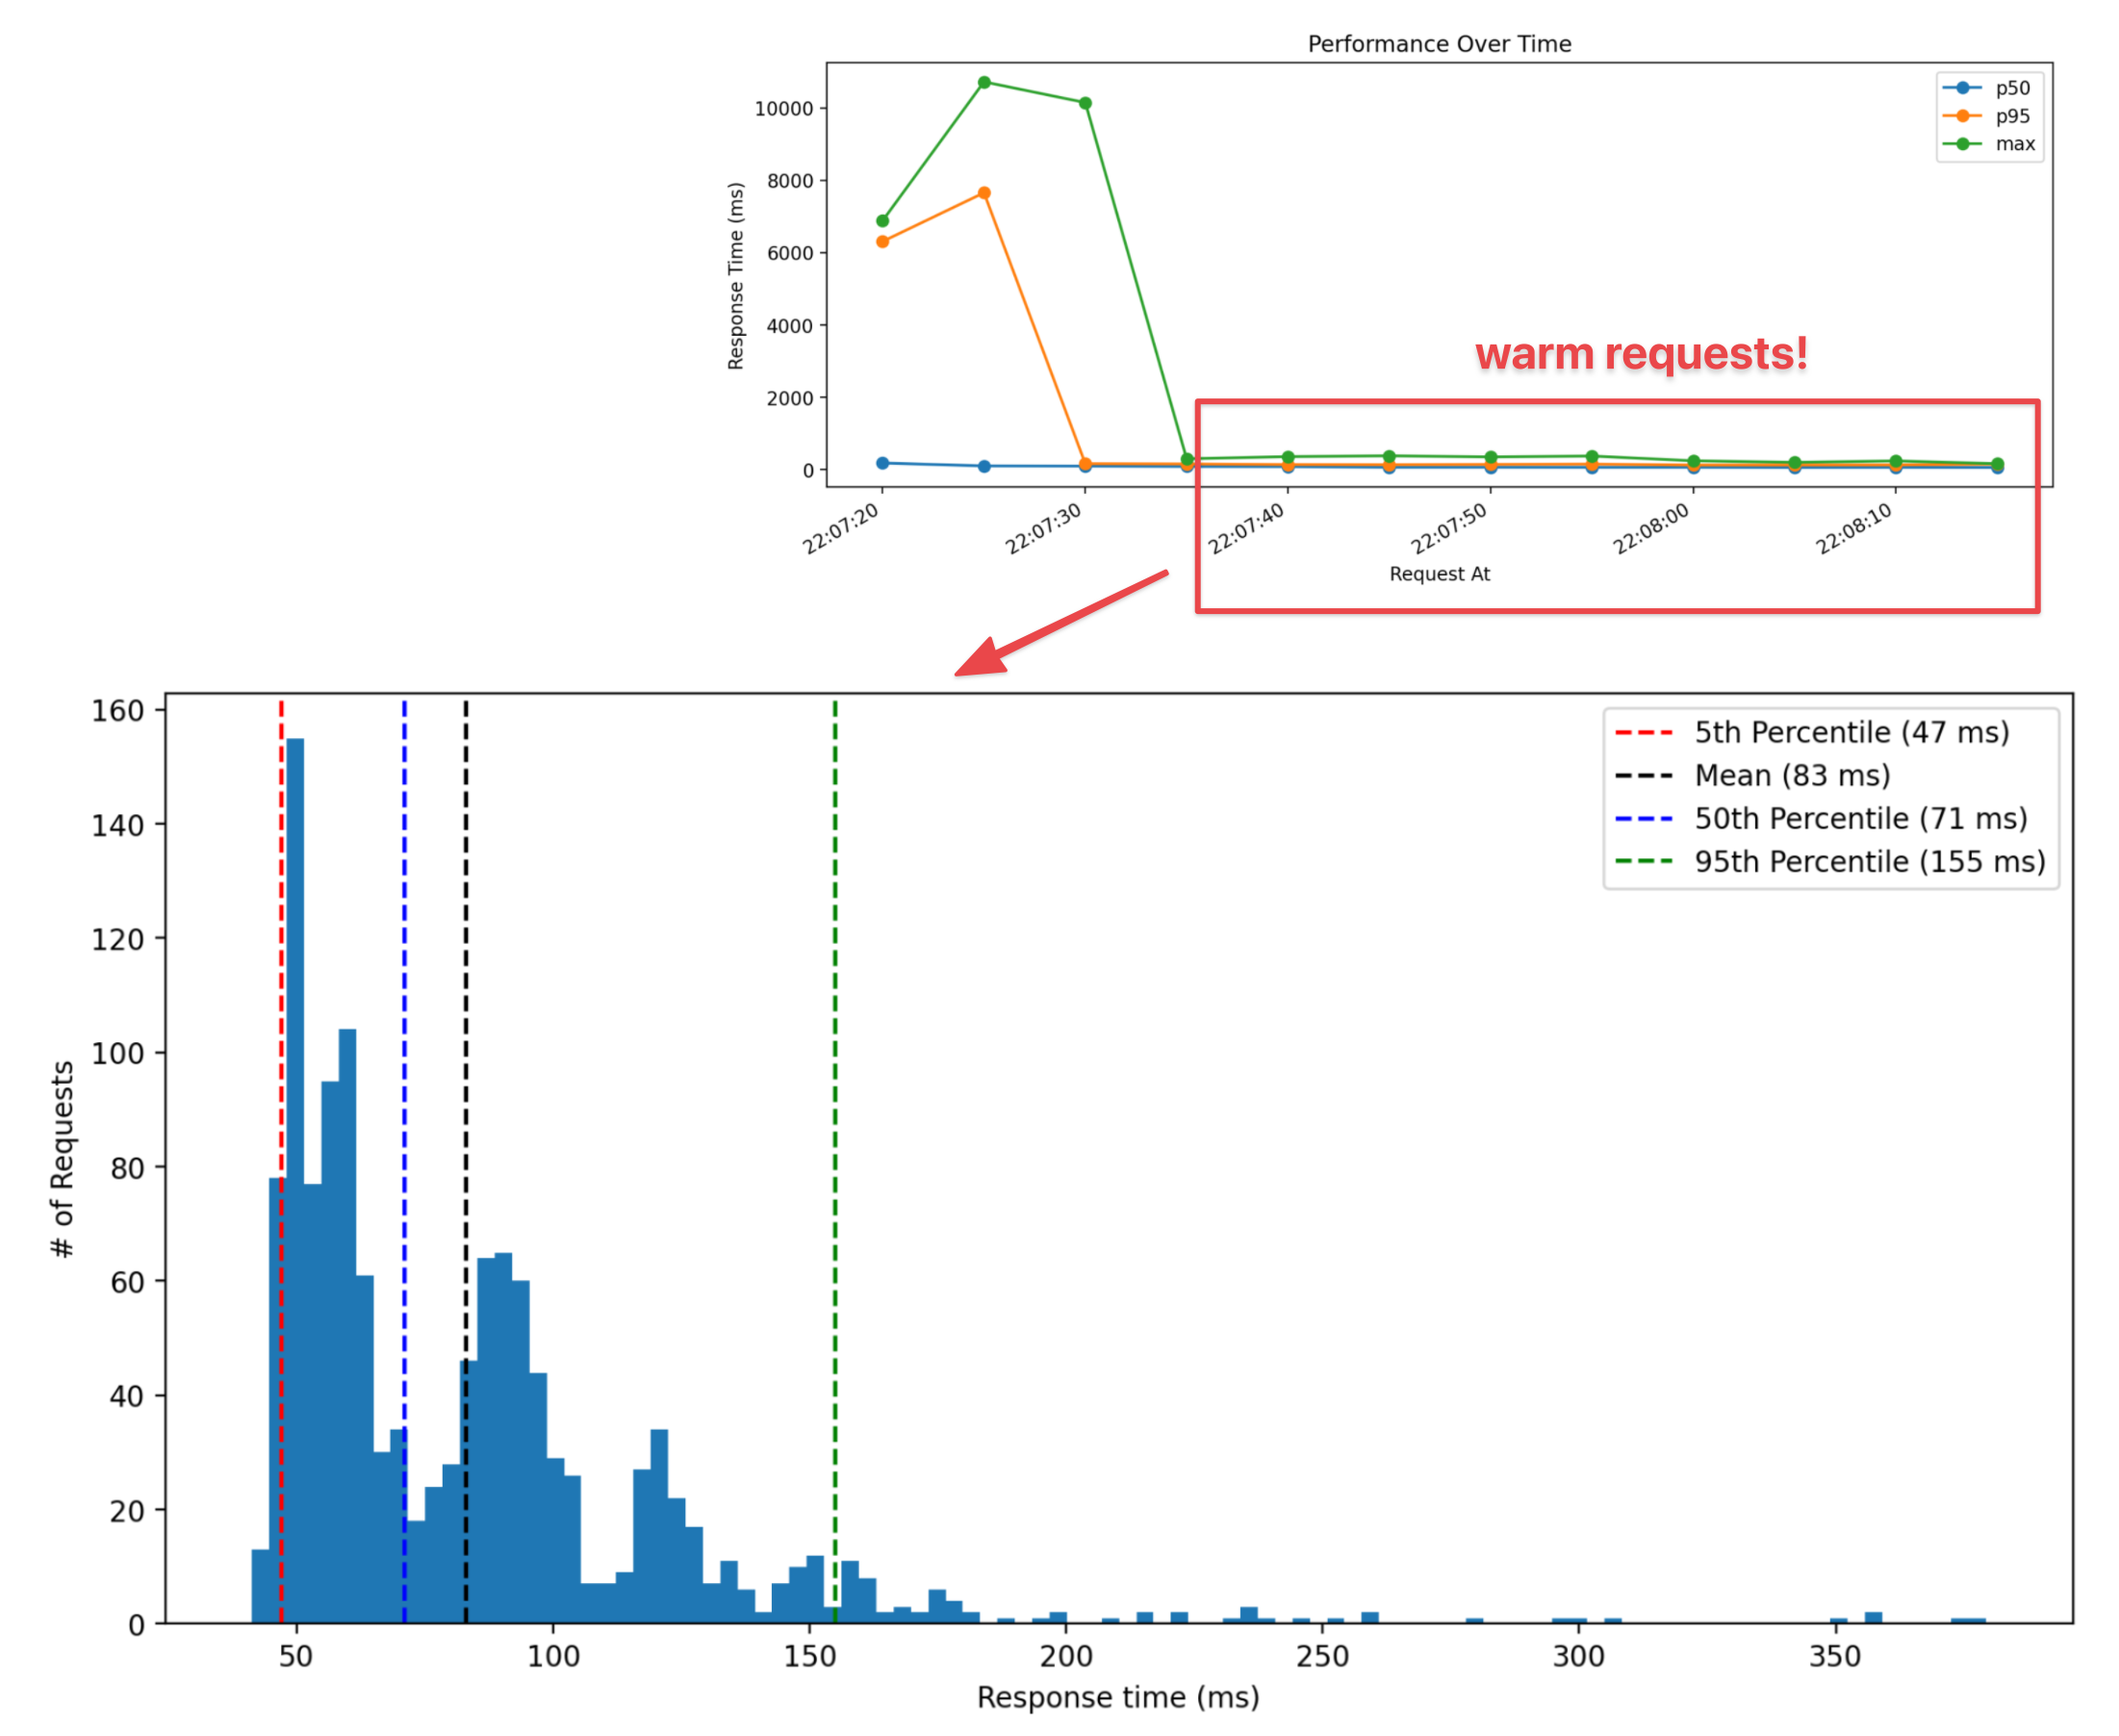
A typical run of the locust load test I described above would have a profile like the one in the graph below. In the first 15 seconds the 100 users all spawn and start making requests. In response to the increased demand, AWS Lambda immediately starts provisioning new Lambda instances. During the load tests I ran, it would spin up 100 functions that could then concurrently process requests. During these first 15 seconds, you can see the p95 and max response times taking between 6-11 seconds. For the duration of the test, the response time distribution narrows as the p95 and max response times become closer to the median, since all the Lambda functions are warmed up.
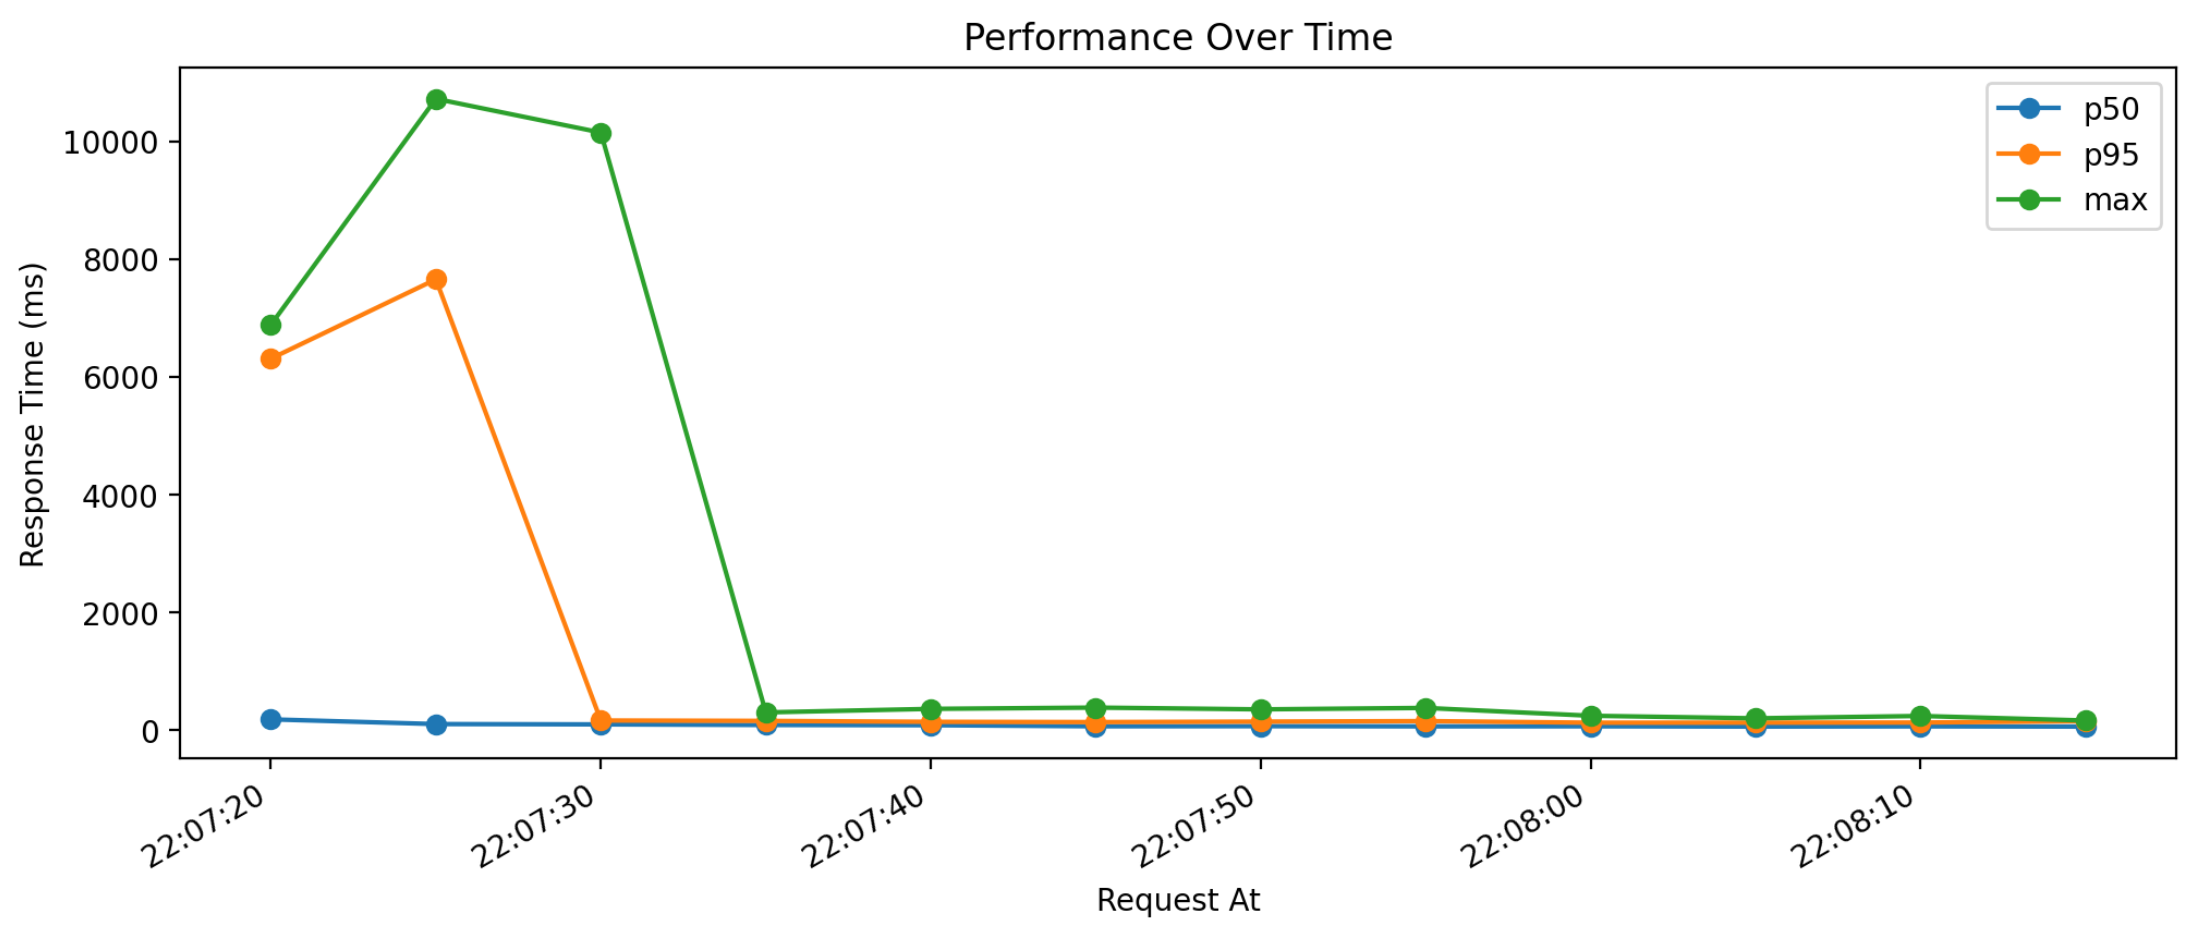
This particular performance run was for the Docker image that loaded a 140MB model from disk. You can see the cold starts (defined as any response time > 1000ms) were just under 6 seconds on average.
Once the Lambda functions were warmed up, average response times were under 90ms!
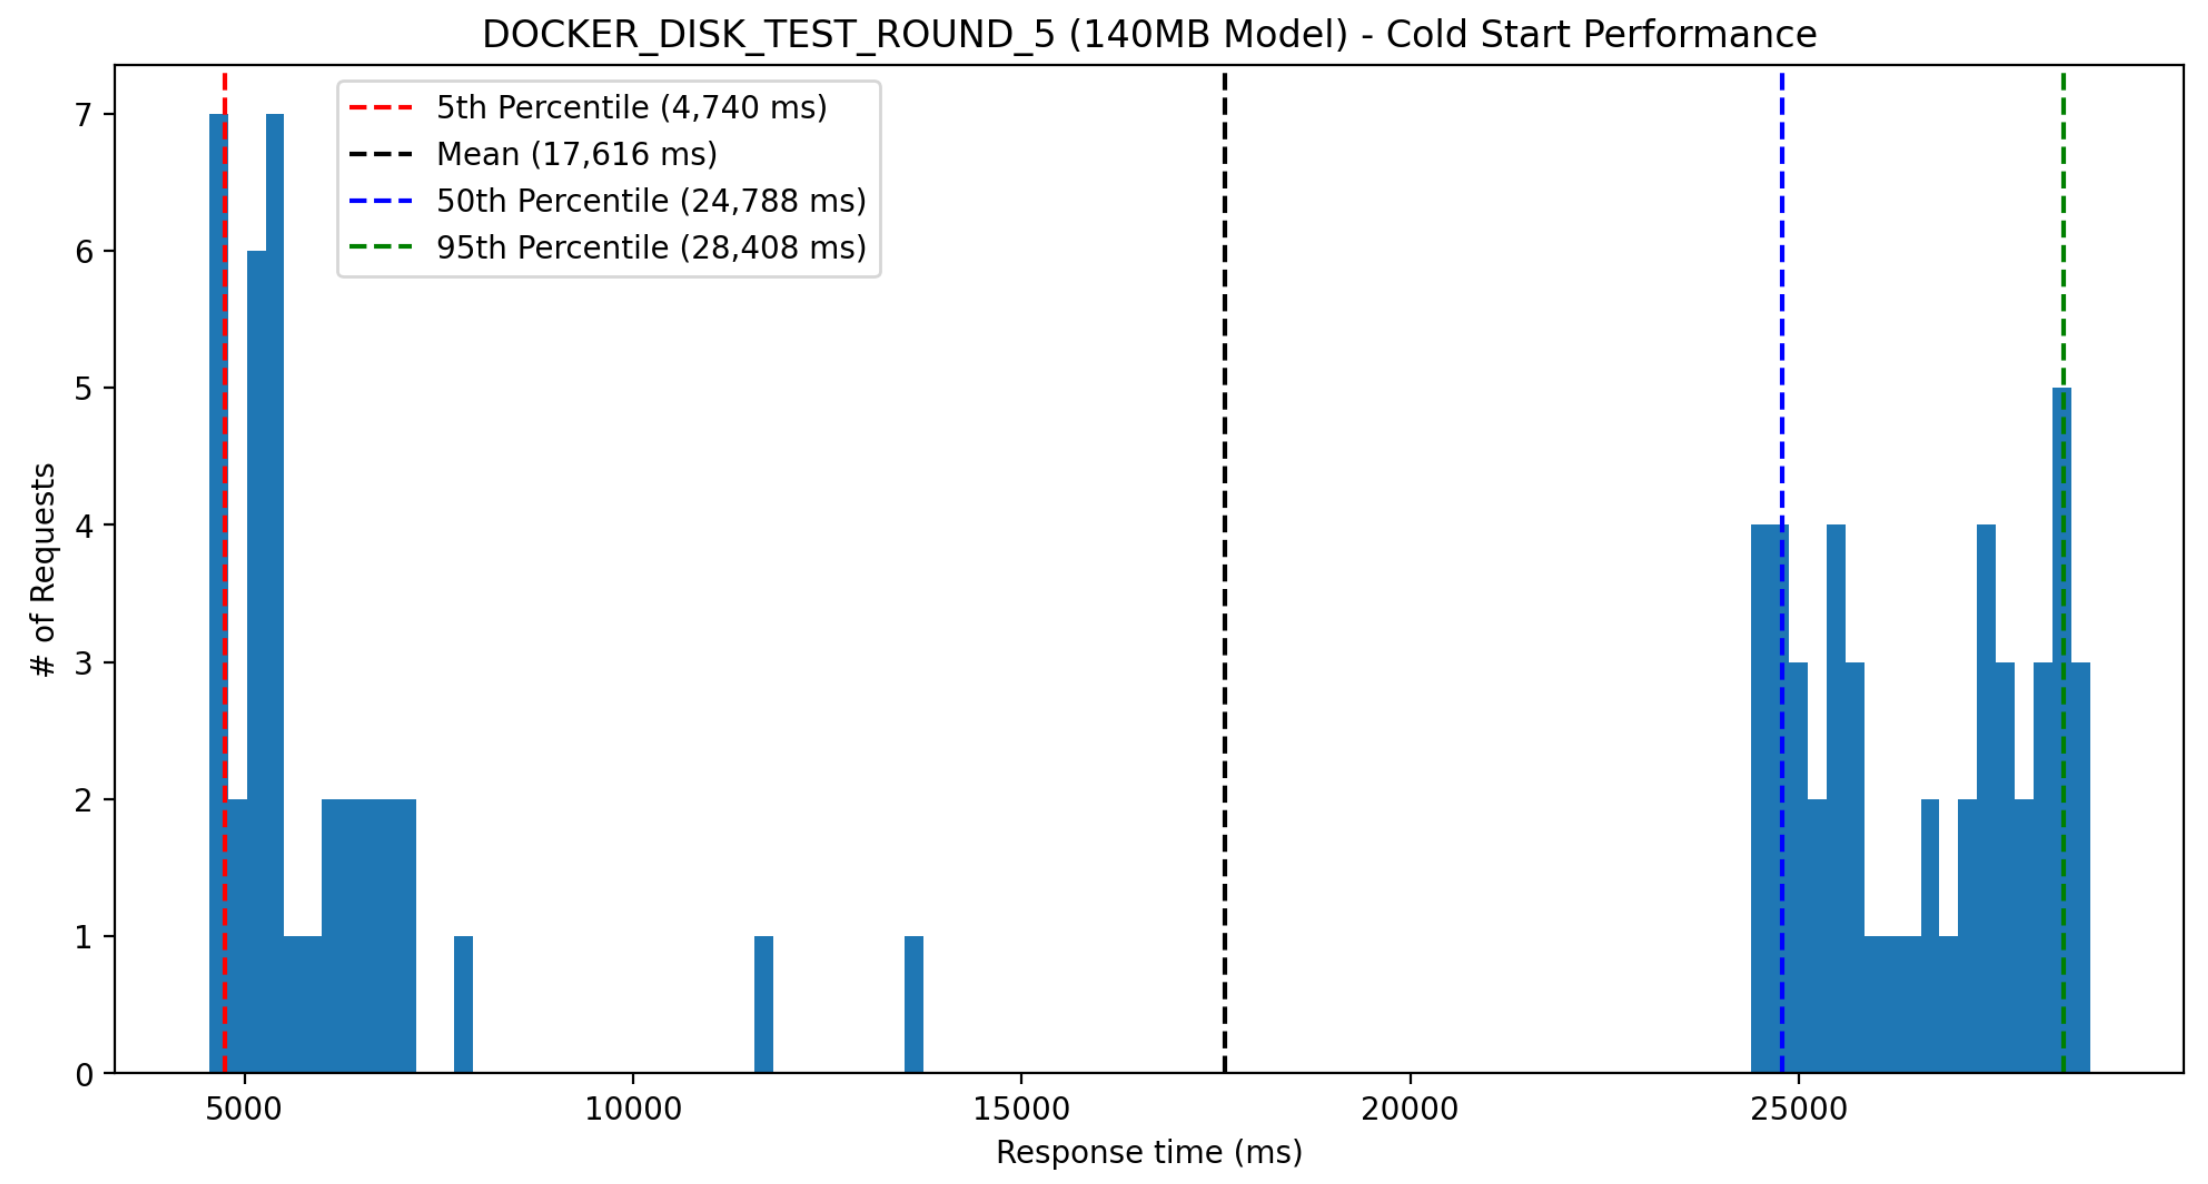
⚠️ Super cold starts™ for Docker deployments
When load testing a newly deployed Lambda function, the cold starts will be considerably longer than what I showed above. Here’s a profile from one of the load tests for the setup where the 140MB model was loaded from disk. As you can see, there’s a bimodal distribution where a bunch of cold starts are in the 5-7 second range and the other set are >25 seconds!
After a quick Google, I found this comment:
From my reading AWS has a huge docker cache on each server to help speed things up. They also can run a container without loading the entire container.
My guess is that these “super cold starts” occur when the cached Docker image is not available, and must be downloaded. After waiting ~15 minutes and running another load test on the same Lambda function, I would no longer see these super cold starts, which seems to support this hypothesis. It’s worth noting that for whatever reason, the other setup I tested where the model was loaded from S3 instead of being baked into the Docker image had significantly shorter super cold starts, despite the docker image only being ~25% smaller.
Cold starts performance summary
Here’s a summary of the cold start performance from all the load tests I ran for each model setup. Cold starts were identified as any response taking longer than 1000ms. Both setups perform the same once the Lambda’s are warm, so it’s not worth comparing those response times. As a reminder:
- The
DOCKER_DISKsetup has the pickled model file baked into the image, and is loaded from disk upon Lambda instantiation - The
DOCKER_S3setup instead loads the model from S3 upon Lambda instantiation, resulting in a Docker image that is smaller by<model_size>MB
All values shown are in milliseconds.
| lambda_setup | model_size | mean | p25 | p50 | p75 | p95 | p99 | max |
|---|---|---|---|---|---|---|---|---|
| DOCKER_DISK | 1. 140MB | 10,629 | 5,008 | 5,572 | 8,446 | 29,161 | 29,217 | 29,326 |
| DOCKER_S3 | 1. 140MB | 7,108 | 5,260 | 5,706 | 8,679 | 13,063 | 14,394 | 14,712 |
| DOCKER_DISK | 2. 420MB | 9,490 | 7,800 | 8,312 | 8,907 | 29,083 | 29,181 | 29,220 |
| DOCKER_S3 | 2. 420MB | 10,765 | 9,409 | 10,096 | 11,523 | 15,232 | 16,561 | 18,787 |
| DOCKER_DISK | 3. 1090MB | 19,802 | 16,289 | 17,590 | 24,765 | 29,134 | 29,197 | 29,233 |
| DOCKER_S3 | 3. 1090MB | 20,236 | 19,310 | 20,172 | 21,038 | 23,046 | 24,052 | 29,155 |
Some main observations:
- Looking at the p50 cold start times, the
DOCKER_DISKsetup performs better than theDOCKER_S3setup. The performance gains become larger as the model size increases. This makes sense since it’s faster to load from disk than over the network. - Looking at the p99 & max cold start times, the
DOCKER_DISKsetup performs worse than theDOCKER_S3setup- These will be the “super cold starts” I was discussing above
- API gateway has a max timeout limit of 30 seconds, so the stats here are actually misleading, since it’s not measuring the time it would have taken for the Lambda function to cold start and then serve the request. For the
DOCKER_DISKsetup with the 1090MB model size, I manually inspected the logs and saw instancing times taking ~100 seconds!
- Cold start times for larger model deployments are really long, a p50 of almost 10 seconds for a 420MB model and almost 20 seconds for a 1GB model.
Closing remarks
The container image support release has made AWS Lambda a much more attractive option for serving ML models. Deploying and updating a serverless ML endpoint is much simpler and a less risky process as a result. However, container image support did not solve the cold start problem. In fact, it appears to have made it worse. Even though cold starts will only affect a very small fraction of users, the experience for those users will be abysmal: waiting between 5 and 30 seconds for a response. If you are using a Docker based Lambda function for any web service, you should consider using their provisioned concurrency5 functionality in order to prevent these long cold starts.
Notes
All the supporting code for this post can be found in this repo.
[1] I’ve never used used layers in my Lambda deployments, but the idea does not sound great to me. Tensorflow for example is over 400MB (ref), so would have to go into its own layer with nothing else.
[2] According to this article, containers will not get re-used after 15 minutes of inactivity.
[3] Dataset originally from here, but I ended up using this copy which combined the train & test datasets into a single file. Full model training code available here.
[4] See the code in this notebook. It looks something like this:
[5] Using provisioned concurrency will significantly increase costs. Ideally, AWS would only start directing requests to the new instances once they are warm when autoscaling, which would reduce the need for this…An untested workaround you could try as a cheaper alternate: schedule a separate lambda function that runs every 10 minutes and fires off X simulataneous requests (use locust!). This should cause X new lambda functions to spin up, and in theory they’d stay warm for the next 15 minutes. X would be the desired number of Lambda functions available to serve requests.